Pizza Hut 2015 Annual Report Download - page 133
Download and view the complete annual report
Please find page 133 of the 2015 Pizza Hut annual report below. You can navigate through the pages in the report by either clicking on the pages listed below, or by using the keyword search tool below to find specific information within the annual report.-
 1
1 -
2
-
3
-
4
-
5
-
6
-
7
-
8
-
9
-
10
-
11
-
12
-
13
-
14
-
15
-
16
-
17
-
18
-
19
-
20
-
21
-
22
-
23
-
24
-
25
-
26
-
27
-
28
-
29
-
30
-
31
-
32
-
33
-
34
-
35
-
36
-
37
-
38
-
39
-
40
-
41
-
42
-
43
-
44
-
45
-
46
-
47
-
48
-
49
-
50
-
51
-
52
-
53
-
54
-
55
-
56
-
57
-
58
-
59
-
60
-
61
-
62
-
63
-
64
-
65
-
66
-
67
-
68
-
69
-
70
-
71
-
72
-
73
-
74
-
75
-
76
-
77
-
78
-
79
-
80
-
81
-
82
-
83
-
84
-
85
-
86
-
87
-
88
-
89
-
90
-
91
-
92
-
93
-
94
-
95
-
96
-
97
-
98
-
99
-
100
-
101
-
102
-
103
-
104
-
105
-
106
-
107
-
108
-
109
-
110
-
111
-
112
-
113
-
114
-
115
-
116
-
117
-
118
-
119
-
120
-
121
-
122
-
 123
123 -
 124
124 -
 125
125 -
 126
126 -
 127
127 -
 128
128 -
 129
129 -
 130
130 -
 131
131 -
 132
132 -
 133
133 -
 134
134 -
 135
135 -
 136
136 -
 137
137 -
 138
138 -
 139
139 -
 140
140 -
 141
141 -
 142
142 -
 143
143 -
144
-
145
-
146
-
147
-
148
-
149
-
150
-
151
-
152
-
153
-
154
-
155
-
156
-
157
-
158
-
159
-
160
-
161
-
162
-
163
-
164
-
165
-
166
-
167
-
168
-
169
-
170
-
171
-
172
-
173
-
174
-
175
-
176
-
177
-
178
-
179
-
180
-
181
-
182
-
183
-
184
-
185
-
186
 |
 |

YUM! BRANDS, INC.-2015 Form10-K 25
Form 10-K
PART II
ITEM7Management’s Discussion and Analysis of Financial Condition and Results of Operations
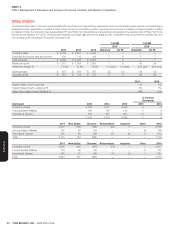
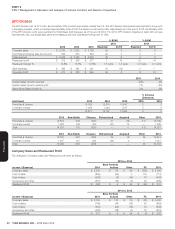
Taco Bell Division
The Taco Bell Division has 6,400 units, the vast majority of which are in the U.S. The Company owns 15% of the Taco Bell units in the U.S., where the
brand has historically achieved high restaurant margins and returns. For 2015, Taco Bell targeted about 150 net new units, low-single-digit same-store
sales growth and Operating Profit growth of 6%.
% B/(W) % B/(W)
2015 2014
2015 2014 2013 Reported Ex FX Reported Ex FX
Company sales $ 1,541 $ 1,452 $ 1,474 6 6 (2) (2)
Franchise and license fees and income 447 411 395 9 9 4 4
Total revenues $ 1,988 $ 1,863 $ 1,869 7 7 — —
Restaurant profit $ 343 $ 274 $ 287 25 25 (5) (5)
Restaurant margin % 22.3% 18.9% 19.5% 3.4 ppts. 3.4 ppts. (0.6) ppts. (0.6) ppts.
G&A expenses $ 228 $ 185 $ 206 (23) (23) 10 10
Operating Profit $ 539 $ 480 $ 456 12 12 5 5
2015 2014
System Sales Growth, reported 8% 4%
System Sales Growth, excluding FX 8% 4%
Same-Store Sales Growth % 5% 3%
% Increase
(Decrease)
Unit Count 2015 2014 2013 2015 2014
Franchise & License 5,506 5,273 5,157 4 2
Company-owned 894 926 891 (3) 4
6,400 6,199 6,048 3 2
2014 New Builds Closures Refranchised Acquired Other 2015
Franchise & License 5,273 239 (80) 65 — 9 5,506
Company-owned 926 37 (4) (65) — — 894
Total 6,199 276 (84) — — 9 6,400
2013 New Builds Closures Refranchised Acquired Other 2014
Franchise & License 5,157 209 (90) 3 (12) 6 5,273
Company-owned 891 27 (1) (3) 12 — 926
Total 6,048 236 (91) — — 6 6,199
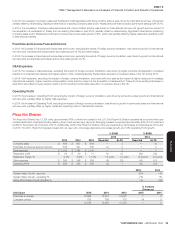
Company Sales and Restaurant Profit
The changes in Company sales and Restaurant profit were as follows:
Income / (Expense)
2015 vs. 2014
2014
Store Portfolio
Actions Other 2015
Company sales $ 1,452 $ 38 $ 51 $ 1,541
Cost of sales (431) (10) 20 (421)
Cost of labor (414) (12) (1) (427)
Occupancy and other (333) (11) (6) (350)
Restaurant Profit $ 274 $ 5 $ 64 $ 343
Income / (Expense)
2014 vs. 2013
2013
Store Portfolio
Actions Other 2014
Company sales $ 1,474 $ (47) $ 25 $ 1,452
Cost of sales (424) 14 (21) (431)
Cost of labor (419) 14 (9) (414)
Occupancy and other (344) 12 (1) (333)
Restaurant Profit $ 287 $ (7) $ (6) $ 274