Pizza Hut 2015 Annual Report Download - page 63
Download and view the complete annual report
Please find page 63 of the 2015 Pizza Hut annual report below. You can navigate through the pages in the report by either clicking on the pages listed below, or by using the keyword search tool below to find specific information within the annual report.-
 1
1 -
2
-
3
-
4
-
5
-
6
-
7
-
8
-
9
-
10
-
11
-
12
-
13
-
14
-
15
-
16
-
17
-
18
-
19
-
20
-
21
-
22
-
23
-
24
-
25
-
26
-
27
-
28
-
29
-
30
-
31
-
32
-
33
-
34
-
35
-
36
-
37
-
38
-
39
-
40
-
41
-
42
-
43
-
44
-
45
-
46
-
47
-
48
-
49
-
50
-
51
-
52
-
 53
53 -
 54
54 -
 55
55 -
 56
56 -
 57
57 -
 58
58 -
 59
59 -
 60
60 -
 61
61 -
 62
62 -
 63
63 -
 64
64 -
 65
65 -
 66
66 -
 67
67 -
 68
68 -
 69
69 -
 70
70 -
 71
71 -
 72
72 -
 73
73 -
74
-
75
-
76
-
77
-
78
-
79
-
80
-
81
-
82
-
83
-
84
-
85
-
86
-
87
-
88
-
89
-
90
-
91
-
92
-
93
-
94
-
95
-
96
-
97
-
98
-
99
-
100
-
101
-
102
-
103
-
104
-
105
-
106
-
107
-
108
-
109
-
110
-
111
-
112
-
113
-
114
-
115
-
116
-
117
-
118
-
119
-
120
-
121
-
122
-
123
-
124
-
125
-
126
-
127
-
128
-
129
-
130
-
131
-
132
-
133
-
134
-
135
-
136
-
137
-
138
-
139
-
140
-
141
-
142
-
143
-
144
-
145
-
146
-
147
-
148
-
149
-
150
-
151
-
152
-
153
-
154
-
155
-
156
-
157
-
158
-
159
-
160
-
161
-
162
-
163
-
164
-
165
-
166
-
167
-
168
-
169
-
170
-
171
-
172
-
173
-
174
-
175
-
176
-
177
-
178
-
179
-
180
-
181
-
182
-
183
-
184
-
185
-
186
 |
 |

YUM! BRANDS, INC.-2016Proxy Statement 49
Proxy Statement
EXECUTIVE COMPENSATION
IV. 2015 Named Executive Officer Total Direct Compensation and Performance
Summary
Below is a summary of each of our named executive officers’
total direct compensation – which includes base salary,
annual cash bonus, PSUs and SARs – and an overview of
their 2015 performance relative to our annual and long term
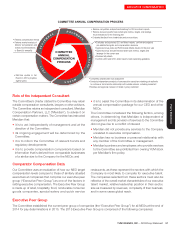
incentive performance goals. The process the Committee
used to determine each officer’s 2015 compensation is
described more fully in “How Compensation Decisions Are
Made” beginning on page 56.
CEO Compensation
Greg Creed
Chief Executive Ofcer
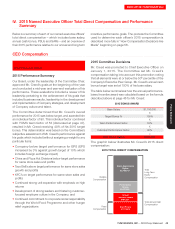
2015 Performance Summary
Our Board, under the leadership of the Committee Chair,
approved Mr.Creed’s goals at the beginning of the year
and conducted a mid-year and year-end evaluation of his
performance. These evaluations included a review of his
leadership pertaining to the achievement of his goals that
included business results, leadership in the development
and implementation of Company strategies, and development
of Company culture and talent.
The Committee determined that Mr.Creed’s overall
performance for 2015 was below target, and awarded him
an individual factor of 90. This individual factor combined
with YUM’s team factor of 53 (discussed at page 47),
resulted in Mr.Creed receiving 48% of his 2015 target
bonus. This determination was based on the Committee’s
subjective assessment of Mr.Creed’s performance against
his goals which included (without assigning a weight to any
particular item):
•
Company below target performance for EPS (EPS
increased by 3% against growth target of 10% which
includes foreign exchange impact)
•
China and Pizza Hut Divisions below target performance
for same store sales and profits
•
Taco Bell’s above target performance for same store sales
growth and profits
•
KFC’s on target performance for same store sales and
profits
•
Continued strong unit expansion with emphasis on high
returns
•Development of strong leaders and fostering customer-
focused employee culture in the Company, and
•
Continued commitment to corporate social responsibility
through the World Food Programme and other hunger
relief organizations
2015 Committee Decisions
Mr.Creed was promoted to Chief Executive Officer on
January 1, 2015. The Committee set Mr.Creed’s
compensation taking into account this promotion noting
that all elements were at or below the 50th percentile of the
Company’s Executive Peer Group. Mr.Creed’s annual cash
bonus target was set at 150% of his base salary.
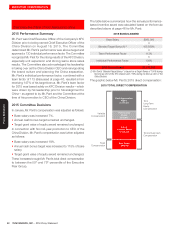
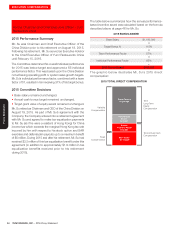
The table below summarizes how the annual performance-
based incentive award was calculated based on the formula
described above at page 46 for Mr.Creed:
2015 BONUS AWARD
Base Salary $1,100,000
X
Target Bonus % 150%
X
Team Performance Factor 53%
X
Individual Performance Factor 90%
=
2015 Bonus Award $787,050
The graphic below illustrates Mr.Creed’s 2015 direct
compensation:
2015 TOTAL DIRECT COMPENSATION
Stock Appreciation
Rights
$3,108,013
Performance
Shares
$1,075,016
Annual
Incentive Award
$787,050
Base Salary
$1,104,615
Variable
Compensation
Fixed
Compensation
Total
Long-Term
Equity
Compensation
Total Annual Cash
Compensation