Pizza Hut 2015 Annual Report Download - page 123
Download and view the complete annual report
Please find page 123 of the 2015 Pizza Hut annual report below. You can navigate through the pages in the report by either clicking on the pages listed below, or by using the keyword search tool below to find specific information within the annual report.-
 1
1 -
2
-
3
-
4
-
5
-
6
-
7
-
8
-
9
-
10
-
11
-
12
-
13
-
14
-
15
-
16
-
17
-
18
-
19
-
20
-
21
-
22
-
23
-
24
-
25
-
26
-
27
-
28
-
29
-
30
-
31
-
32
-
33
-
34
-
35
-
36
-
37
-
38
-
39
-
40
-
41
-
42
-
43
-
44
-
45
-
46
-
47
-
48
-
49
-
50
-
51
-
52
-
53
-
54
-
55
-
56
-
57
-
58
-
59
-
60
-
61
-
62
-
63
-
64
-
65
-
66
-
67
-
68
-
69
-
70
-
71
-
72
-
73
-
74
-
75
-
76
-
77
-
78
-
79
-
80
-
81
-
82
-
83
-
84
-
85
-
86
-
87
-
88
-
89
-
90
-
91
-
92
-
93
-
94
-
95
-
96
-
97
-
98
-
99
-
100
-
101
-
102
-
103
-
104
-
105
-
106
-
107
-
108
-
109
-
110
-
111
-
112
-
 113
113 -
 114
114 -
 115
115 -
 116
116 -
 117
117 -
 118
118 -
 119
119 -
 120
120 -
 121
121 -
 122
122 -
 123
123 -
 124
124 -
 125
125 -
 126
126 -
 127
127 -
 128
128 -
 129
129 -
 130
130 -
 131
131 -
 132
132 -
 133
133 -
134
-
135
-
136
-
137
-
138
-
139
-
140
-
141
-
142
-
143
-
144
-
145
-
146
-
147
-
148
-
149
-
150
-
151
-
152
-
153
-
154
-
155
-
156
-
157
-
158
-
159
-
160
-
161
-
162
-
163
-
164
-
165
-
166
-
167
-
168
-
169
-
170
-
171
-
172
-
173
-
174
-
175
-
176
-
177
-
178
-
179
-
180
-
181
-
182
-
183
-
184
-
185
-
186
 |
 |

YUM! BRANDS, INC.-2015 Form10-K 15
Form 10-K
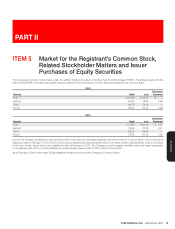
PART II
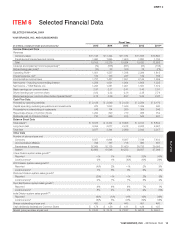
ITEM 6 Selected Financial Data
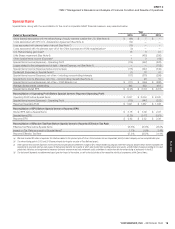
SELECTED FINANCIAL DATA
YUM! BRANDS, INC. AND SUBSIDIARIES
(in millions, except per share and unit amounts)
Fiscal Year
2015 2014 2013 2012 2011(g)
Income Statement Data
Revenues
Company sales $ 11,145 $ 11,324 $11,184 $ 11,833 $ 10,893
Franchise and license fees and income 1,960 1,955 1,900 1,800 1,733
Total 13,105 13,279 13,084 13,633 12,626
Closures and impairment income (expenses)(a) (79) (535) (331) (37) (135)
Refranchising gain (loss)(b) (10) 33 100 78 (72)
Operating Profit(c) 1,921 1,557 1,798 2,294 1,815
Interest expense, net(c) 134 130 247 149 156
Income before income taxes 1,787 1,427 1,551 2,145 1,659
Net Income – including noncontrolling interest 1,298 1,021 1,064 1,608 1,335
Net Income – YUM! Brands, Inc. 1,293 1,051 1,091 1,597 1,319
Basic earnings per common share 2.97 2.37 2.41 3.46 2.81
Diluted earnings per common share 2.92 2.32 2.36 3.38 2.74
Diluted earnings per common share before Special Items(c) 3.18 3.09 2.97 3.25 2.87
Cash Flow Data
Provided by operating activities $ 2,139 $ 2,049 $ 2,139 $ 2,294 $ 2,170
Capital spending, excluding acquisitions and investments 973 1,033 1,049 1,099 940
Proceeds from refranchising of restaurants 246 114 260 364 246
Repurchase shares of Common Stock 1,200 820 770 965 752
Dividends paid on Common Stock 730 669 615 544 481
Balance Sheet Data
Total assets(h) $ 8,075 $ 8,334 $ 8,695 $ 9,013 $ 8,834
Long-term debt 3,054 3,077 2,918 2,932 2,997
Total debt 3,977 3,344 2,989 2,942 3,317
Other Data
Number of stores at year end
Company 8,927 8,664 8,097 7,544 7,403
Unconsolidated Affiliates 796 757 716 660 587
Franchisees & licensees 32,969 32,125 31,420 30,733 29,056
System 42,692 41,546 40,233 38,937 37,046
China Division system sales growth(d)
Reported —% 1% (1)% 23% 35%
Local currency(e) 2% 1% (4)% 20% 29%
KFC Division system sales growth(d)
Reported (4)% 2% —% 2% 9%
Local currency(e) 7% 6% 3% 6% 4%
Pizza Hut Division system sales growth(d)
Reported (2)% —% —% 2% 5%
Local currency(e) 2% 1% 1% 5% 2%
Taco Bell Division system sales growth(d)
Reported 8% 4% 4% 7% 1%
Local currency(e) 8% 4% 4% 9% (1)%
India Division system sales growth(d)(f)
Reported (9)% (1)% 11% 13% 36%
Local currency(e) (5)% 3% 20% 29% 35%
Shares outstanding at year end 420 434 443 451 460
Cash dividends declared per Common Share $ 1.74 $ 1.56 $ 1.41 $ 1.24 $ 1.07
Market price per share at year end $ 74.00 $ 73.14 $ 73.87 $ 64.72 $ 59.01