Pizza Hut 2015 Annual Report Download - page 134
Download and view the complete annual report
Please find page 134 of the 2015 Pizza Hut annual report below. You can navigate through the pages in the report by either clicking on the pages listed below, or by using the keyword search tool below to find specific information within the annual report.-
 1
1 -
2
-
3
-
4
-
5
-
6
-
7
-
8
-
9
-
10
-
11
-
12
-
13
-
14
-
15
-
16
-
17
-
18
-
19
-
20
-
21
-
22
-
23
-
24
-
25
-
26
-
27
-
28
-
29
-
30
-
31
-
32
-
33
-
34
-
35
-
36
-
37
-
38
-
39
-
40
-
41
-
42
-
43
-
44
-
45
-
46
-
47
-
48
-
49
-
50
-
51
-
52
-
53
-
54
-
55
-
56
-
57
-
58
-
59
-
60
-
61
-
62
-
63
-
64
-
65
-
66
-
67
-
68
-
69
-
70
-
71
-
72
-
73
-
74
-
75
-
76
-
77
-
78
-
79
-
80
-
81
-
82
-
83
-
84
-
85
-
86
-
87
-
88
-
89
-
90
-
91
-
92
-
93
-
94
-
95
-
96
-
97
-
98
-
99
-
100
-
101
-
102
-
103
-
104
-
105
-
106
-
107
-
108
-
109
-
110
-
111
-
112
-
113
-
114
-
115
-
116
-
117
-
118
-
119
-
120
-
121
-
122
-
123
-
 124
124 -
 125
125 -
 126
126 -
 127
127 -
 128
128 -
 129
129 -
 130
130 -
 131
131 -
 132
132 -
 133
133 -
 134
134 -
 135
135 -
 136
136 -
 137
137 -
 138
138 -
 139
139 -
 140
140 -
 141
141 -
 142
142 -
 143
143 -
 144
144 -
145
-
146
-
147
-
148
-
149
-
150
-
151
-
152
-
153
-
154
-
155
-
156
-
157
-
158
-
159
-
160
-
161
-
162
-
163
-
164
-
165
-
166
-
167
-
168
-
169
-
170
-
171
-
172
-
173
-
174
-
175
-
176
-
177
-
178
-
179
-
180
-
181
-
182
-
183
-
184
-
185
-
186
 |
 |

YUM! BRANDS, INC.-2015 Form10-K26
Form 10-K
PART II
ITEM7Management’s Discussion and Analysis of Financial Condition and Results of Operations
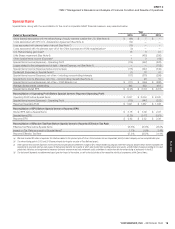
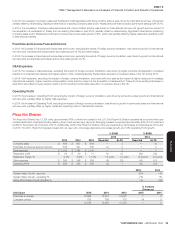
In 2015, the increase in Company sales and Restaurant profit associated with store portfolio actions was driven by net new unit growth. Significant other
factors impacting Company sales and/or Restaurant profit were company same-store sales growth of 4% and commodity deflation.
In 2014, the decrease in Company sales and Restaurant profit associated with store portfolio actions was driven by refranchising, partially offset by net
new unit growth. Significant other factors impacting Company sales and/or Restaurant profit were commodity inflation and higher food and labor costs
due to the launch of breakfast in the U.S., partially offset by company same-store sales growth of 2%.
Franchise and License Fees and Income
In 2015, the increase in Franchise and license fees and income was driven by franchise and license same-store sales growth of 5%, net new unit growth
and lapping franchise incentives provided in the first quarter of 2014 related to the national launch of breakfast.
In 2014, the increase in Franchise and license fees and income was driven by same-store sales growth of 3%, refranchising and net new unit growth,
partially offset by franchise incentives provided in the first quarter of 2014 related to the launch of breakfast.
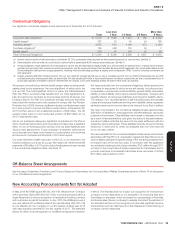
G&A Expenses
In 2015, the increase in G&A expenses was driven by higher incentive compensation costs, investment spending on strategic growth and technology
initiatives, higher U.S. pension costs, higher litigation costs and the creation of the Live Más Scholarship.
In 2014, the decrease in G&A expenses was driven by lower U.S. pension costs and lower incentive compensation costs.
Operating Profit
In 2015, the increase in Operating Profit was driven by same-store sales growth and net new unit growth, partially offset by higher G&A expenses.
In 2014, the increase in Operating Profit was driven by same-store sales growth, lower G&A expenses and net new unit growth, partially offset by higher
restaurant operating costs.
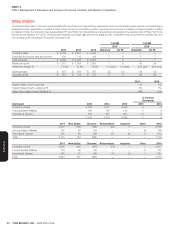
India Division
The India Division has 811 units, predominately KFC and Pizza Hut restaurants. Effective January, 2016 the India Division was segmented by brand,
integrated into the global KFC, Pizza Hut and Taco Bell Divisions, and is no longer a separate operating segment. While our consolidated results will
not be impacted, we will restate our historical segment information during 2016 for consistent presentation.
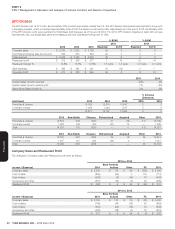
% B/(W) % B/(W)
2015 2014
2015 2014 2013 Reported Ex FX Reported Ex FX
Total revenues(a) $ 115 $ 141 $ 127 (18) (14) 11 16
Operating Profit (loss) $ (19) $ (9) $ (15) (108) (118) 39 35
2015 2014
System Sales Growth, reported(a) (9)% (1)%
System Sales Growth, excluding FX(a) (5)% 3%
Same-Store Sales Growth (Decline)% (13)% (5)%
% Increase
(Decrease)
Unit Count 2015 2014 2013 2015 2014
Franchise & License 693 623 514 11 21
Company-owned 118 210 191 (44) 10
811 833 705 (3) 18
2014 New Builds Closures Refranchised Acquired 2015
Franchise & License 623 54 (70) 86 — 693
Company-owned 210 — (6) (86) — 118
Total 833 54 (76) — — 811
2013 New Builds Closures Refranchised Acquired 2014
Franchise & License 514 110 (21) 20 — 623
Company-owned 191 46 (7) (20) — 210
Total 705 156 (28) — — 833
(a) Effective the beginning of 2014, results from our Mauritius stores are included in KFC and Pizza Hut Divisions as applicable. Prior year units have been adjusted for comparability while
division System Sales Growth, Total Revenues and Operating Profit (loss) have not been restated due to the immaterial dollar impact of this change. While there was no impact to our
consolidated results, this change negatively impacted India’s 2014 System Sales Growth, reported and excluding FX, by 10% and 11%, respectively. This change negatively impacted India’s
2014 Total revenues by 2% and Operating Profit (loss) by $1 million.