Pizza Hut 2015 Annual Report Download - page 61
Download and view the complete annual report
Please find page 61 of the 2015 Pizza Hut annual report below. You can navigate through the pages in the report by either clicking on the pages listed below, or by using the keyword search tool below to find specific information within the annual report.-
 1
1 -
2
-
3
-
4
-
5
-
6
-
7
-
8
-
9
-
10
-
11
-
12
-
13
-
14
-
15
-
16
-
17
-
18
-
19
-
20
-
21
-
22
-
23
-
24
-
25
-
26
-
27
-
28
-
29
-
30
-
31
-
32
-
33
-
34
-
35
-
36
-
37
-
38
-
39
-
40
-
41
-
42
-
43
-
44
-
45
-
46
-
47
-
48
-
49
-
50
-
 51
51 -
 52
52 -
 53
53 -
 54
54 -
 55
55 -
 56
56 -
 57
57 -
 58
58 -
 59
59 -
 60
60 -
 61
61 -
 62
62 -
 63
63 -
 64
64 -
 65
65 -
 66
66 -
 67
67 -
 68
68 -
 69
69 -
 70
70 -
 71
71 -
72
-
73
-
74
-
75
-
76
-
77
-
78
-
79
-
80
-
81
-
82
-
83
-
84
-
85
-
86
-
87
-
88
-
89
-
90
-
91
-
92
-
93
-
94
-
95
-
96
-
97
-
98
-
99
-
100
-
101
-
102
-
103
-
104
-
105
-
106
-
107
-
108
-
109
-
110
-
111
-
112
-
113
-
114
-
115
-
116
-
117
-
118
-
119
-
120
-
121
-
122
-
123
-
124
-
125
-
126
-
127
-
128
-
129
-
130
-
131
-
132
-
133
-
134
-
135
-
136
-
137
-
138
-
139
-
140
-
141
-
142
-
143
-
144
-
145
-
146
-
147
-
148
-
149
-
150
-
151
-
152
-
153
-
154
-
155
-
156
-
157
-
158
-
159
-
160
-
161
-
162
-
163
-
164
-
165
-
166
-
167
-
168
-
169
-
170
-
171
-
172
-
173
-
174
-
175
-
176
-
177
-
178
-
179
-
180
-
181
-
182
-
183
-
184
-
185
-
186
 |
 |

YUM! BRANDS, INC.-2016Proxy Statement 47
Proxy Statement
EXECUTIVE COMPENSATION
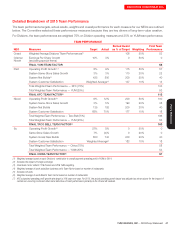
Detailed Breakdown of 2015 Team Performance
The team performance targets, actual results, weights and overall performance for each measure for our NEOs are outlined
below. The Committee selected these performance measures because they are key drivers of long-term value creation.
For Divisions, the team performances are weighted 75% on Division operating measures and 25% on YUM team performance.
TEAM PERFORMANCE
NEO Measures Target Actual
Earned Award
as % of Target Weighting
Final Team
Performance
Creed Weighted Average Divisions’ Team Performances(1) 106 50% 53
Grismer
Novak
Earnings Per Share Growth
(excluding special items)
10% 3% 0 50% 0
FINAL YUM TEAM FACTOR 53
Pant Operating Profit Growth(2,7) 8% 9% 115 50% 57
System Same-Store Sales Growth 3% 3% 110 20% 22
System Net Builds(5) 425 500 200 20% 40
System Customer Satisfaction Weighted Average(4) 137 10% 14
Total Weighted Team Performance — KFC (75%) 133
Total Weighted Team Performance — YUM (25%) 53
FINAL KFC TEAM FACTOR(3) 113
Niccol Operating Profit Growth(2) 6% 12% 200 50% 100
System Same-Store Sales Growth 3% 5% 190 20% 38
System Net Builds 125 192 200 20% 40
System Customer Satisfaction 68% 70% 177 10% 18
Total Weighted Team Performance — Taco Bell (75%)
196
Total Weighted Team Performance — YUM (25%) 53
FINAL TACO BELL TEAM FACTOR(3) 160
Su Operating Profit Growth(2) 27% 8% 0 50% 0
Same Store Sales Growth 7% (4)% 0 20% 0
System Gross New Builds 650 743 200 20% 40
System Customer Satisfaction Weighted Average(6) 183 10% 18
Total Weighted Team Performance — China (75%) 58
Total Weighted Team Performance — YUM (25%) 53
FINAL CHINA TEAM FACTOR(3) 57
(1) Weighted average based on each Division’s contribution to overall segment operating profit of YUM in 2014.
(2) Excludes the impact of foreign exchange.
(3) Final team Factor reflects 75% Division and 25% YUM weighting.
(4) Weighted average of each subsidiary business unit’s Team Factor based on number of restaurants.
(5) Excludes US units.
(6) Weighted average of each Brand’s Team Factor based on number of restaurants.
(7) KFC’s standard operating profit growth rate target is 10% year-over-year. For 2015, the actual operating growth target was adjusted as shown above for the impact of
certain non-recurring costs and other items distortive of brand performance primarily in the US and UK markets.