Pizza Hut 2015 Annual Report Download - page 126
Download and view the complete annual report
Please find page 126 of the 2015 Pizza Hut annual report below. You can navigate through the pages in the report by either clicking on the pages listed below, or by using the keyword search tool below to find specific information within the annual report.-
 1
1 -
2
-
3
-
4
-
5
-
6
-
7
-
8
-
9
-
10
-
11
-
12
-
13
-
14
-
15
-
16
-
17
-
18
-
19
-
20
-
21
-
22
-
23
-
24
-
25
-
26
-
27
-
28
-
29
-
30
-
31
-
32
-
33
-
34
-
35
-
36
-
37
-
38
-
39
-
40
-
41
-
42
-
43
-
44
-
45
-
46
-
47
-
48
-
49
-
50
-
51
-
52
-
53
-
54
-
55
-
56
-
57
-
58
-
59
-
60
-
61
-
62
-
63
-
64
-
65
-
66
-
67
-
68
-
69
-
70
-
71
-
72
-
73
-
74
-
75
-
76
-
77
-
78
-
79
-
80
-
81
-
82
-
83
-
84
-
85
-
86
-
87
-
88
-
89
-
90
-
91
-
92
-
93
-
94
-
95
-
96
-
97
-
98
-
99
-
100
-
101
-
102
-
103
-
104
-
105
-
106
-
107
-
108
-
109
-
110
-
111
-
112
-
113
-
114
-
115
-
 116
116 -
 117
117 -
 118
118 -
 119
119 -
 120
120 -
 121
121 -
 122
122 -
 123
123 -
 124
124 -
 125
125 -
 126
126 -
 127
127 -
 128
128 -
 129
129 -
 130
130 -
 131
131 -
 132
132 -
 133
133 -
 134
134 -
 135
135 -
 136
136 -
137
-
138
-
139
-
140
-
141
-
142
-
143
-
144
-
145
-
146
-
147
-
148
-
149
-
150
-
151
-
152
-
153
-
154
-
155
-
156
-
157
-
158
-
159
-
160
-
161
-
162
-
163
-
164
-
165
-
166
-
167
-
168
-
169
-
170
-
171
-
172
-
173
-
174
-
175
-
176
-
177
-
178
-
179
-
180
-
181
-
182
-
183
-
184
-
185
-
186
 |
 |

YUM! BRANDS, INC.-2015 Form10-K18
Form 10-K
PART II
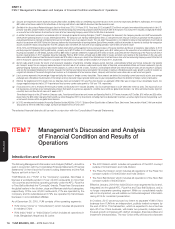
ITEM7Management’s Discussion and Analysis of Financial Condition and Results of Operations
Foreign currency translation from our international operations negatively impacted EPS growth by 6 percentage points.
2015 financial highlights are below:
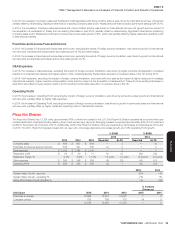
China
Division
KFC
Division
Pizza Hut
Division
Taco Bell
Division
India
Division
System Sales Growth (Decline) 2% 7% 2% 8% (5)%
Operating Profit Growth (Decline) 8% 8% 1% 12% (118)%
Same Store Sales Growth (Decline) (4)% 3% 1% 5% (13)%
New Unit Openings 743 715 577 276 54
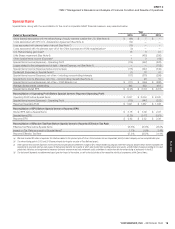
Worldwide
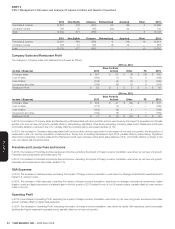
The Consolidated Results of Operations for the years to date ended December 26, 2015, December 27, 2014 and December 28, 2013 are presented
below:
Amount % B/(W)
2015 2014 2013 2015 2014
Company sales $ 11,145 $ 11,324 $ 11,184 (2) 1
Franchise and license fees and income 1,960 1,955 1,900 — 3
Total Revenues $ 13,105 $ 13,279 $ 13,084 (1) 1
Restaurant Profit $ 1,786 $ 1,642 $ 1,683 9 (2)
Restaurant Margin % 16.0% 14.5% 15.0% 1.5 ppts. (0.5) ppts.
Operating Profit $ 1,921 $ 1,557 $ 1,798 23 (13)
Interest expense, net 134 130 247 (4) 47
Income tax provision 489 406 487 (20) 17
Net Income – including noncontrolling interests 1,298 1,021 1,064 27 (4)
Net Income (loss) – noncontrolling interests 5 (30) (27) NM (12)
Net Income – YUM! Brands, Inc. $ 1,293 $ 1,051 $ 1,091 23 (4)
Diluted EPS(a) $ 2.92 $ 2.32 $ 2.36 26 (2)
Diluted EPS Before Special Items(a) $ 3.18 $ 3.09 $ 2.97 3 4
Reported Effective Tax Rate 27.3% 28.5% 31.4%
Effective Tax Rate Before Special Items 25.6% 25.5% 28.0%
(a) See Note 3 for the number of shares used in these calculations.
2015 2014
System Sales Growth, reported (1)% 2%
System Sales Growth, excluding FX 5% 3%
% Increase
(Decrease)
Unit Count 2015 2014 2013 2015 2014
Franchise & License 32,969 32,125 31,420 3 2
Company-owned 8,927 8,664 8,097 3 7
Unconsolidated Affiliates 796 757 716 5 6
42,692 41,546 40,233 3 3