Pizza Hut 2015 Annual Report Download - page 127
Download and view the complete annual report
Please find page 127 of the 2015 Pizza Hut annual report below. You can navigate through the pages in the report by either clicking on the pages listed below, or by using the keyword search tool below to find specific information within the annual report.
YUM! BRANDS, INC.-2015 Form10-K 19
Form 10-K
PART II
ITEM7Management’s Discussion and Analysis of Financial Condition and Results of Operations
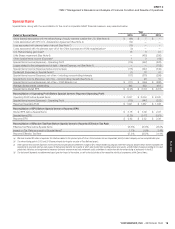
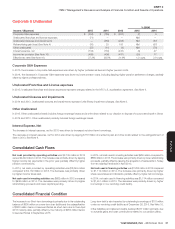
Special Items
Special Items, along with the reconciliation to the most comparable GAAP financial measure, are presented below.
Detail of Special Items
Year
2015 2014 2013
Gains (losses) associated with the refranchising of equity markets outside theU.S. (See Note 4) $ (96) $ 7 $ —
Costs associated with KFC U.S. Acceleration Agreement (See Note 4) (72) — —
Loss associated with planned sale of aircraft (See Note 7) (15) — —
Costs associated with the planned spin-off of the China business and YUM recapitalization(a) (9) — —
U.S. Refranchising gain (loss)(b) 75 6 91
Little Sheep impairment (See Note 4) — (463) (295)
Other Special Items Income (Expense)(c) 1 3 (18)
Special Items Income (Expense) – Operating Profit (116) (447) (222)
Losses related to the extinguishment of debt – Interest Expense, net (See Note 4) — — (118)
Special Items Income (Expense) before income taxes (116) (447) (340)
Tax Benefit (Expense) on Special Items(d) (1) 72 41
Special Items Income (Expense), net of tax – including noncontrolling interests (117) (375) (299)
Special Items Income (Expense), net of tax – noncontrolling interests (See Note 4) — 26 19
Special Items Income (Expense), net of tax – YUM! Brands, Inc. $ (117) $ (349) $ (280)
Average diluted shares outstanding 443 453 461
Special Items diluted EPS $ (0.26) $ (0.77) $ (0.61)
Reconciliation of Operating Profit Before Special Items to Reported Operating Profit
Operating Profit before Special Items $ 2,037 $ 2,004 $ 2,020
Special Items Income (Expense) – Operating Profit (116) (447) (222)
Reported Operating Profit $ 1,921 $ 1,557 $ 1,798
Reconciliation of EPS Before Special Items to Reported EPS
Diluted EPS before Special Items $ 3.18 $ 3.09 $ 2.97
Special Items EPS (0.26) (0.77) (0.61)
Reported EPS $ 2.92 $ 2.32 $ 2.36
Reconciliation of Effective Tax Rate Before Special Items to Reported Effective Tax Rate
Effective Tax Rate before Special Items 25.6% 25.5% 28.0%
Impact on Tax Rate as a result of Special Items(d) 1.7% 3.0% 3.4%
Reported Effective Tax Rate 27.3% 28.5% 31.4%
(a) We have incurred $9 million of expenses for initiatives related to the planned spin-off of our China business into an independent publicly-traded company and our recapitalization plan.
(b) The refranchising gains in 2015 and 2013 were primarily due to gains on sales of Taco Bell restaurants.
(c) Other Special Items Income (Expense) in 2013 primarily includes pension settlement charges of $10 million related to a program where the company allowed certain former employees the
opportunity to voluntarily elect an early payout of their pension benefits, the majority of which were funded from existing pension plan assets, and $5 million of expense relating to U.S. G&A
productivity initiatives and realignment of resources (primarily severance and early retirement costs) undertaken in conjunction with the refranchising of restaurants in the U.S.
(d) The tax benefit (expense) was determined based upon the impact of the nature, as well as the jurisdiction of the respective individual components within Special Items.


