Pizza Hut 2015 Annual Report Download - page 58
Download and view the complete annual report
Please find page 58 of the 2015 Pizza Hut annual report below. You can navigate through the pages in the report by either clicking on the pages listed below, or by using the keyword search tool below to find specific information within the annual report.-
 1
1 -
2
-
3
-
4
-
5
-
6
-
7
-
8
-
9
-
10
-
11
-
12
-
13
-
14
-
15
-
16
-
17
-
18
-
19
-
20
-
21
-
22
-
23
-
24
-
25
-
26
-
27
-
28
-
29
-
30
-
31
-
32
-
33
-
34
-
35
-
36
-
37
-
38
-
39
-
40
-
41
-
42
-
43
-
44
-
45
-
46
-
47
-
 48
48 -
 49
49 -
 50
50 -
 51
51 -
 52
52 -
 53
53 -
 54
54 -
 55
55 -
 56
56 -
 57
57 -
 58
58 -
 59
59 -
 60
60 -
 61
61 -
 62
62 -
 63
63 -
 64
64 -
 65
65 -
 66
66 -
 67
67 -
 68
68 -
69
-
70
-
71
-
72
-
73
-
74
-
75
-
76
-
77
-
78
-
79
-
80
-
81
-
82
-
83
-
84
-
85
-
86
-
87
-
88
-
89
-
90
-
91
-
92
-
93
-
94
-
95
-
96
-
97
-
98
-
99
-
100
-
101
-
102
-
103
-
104
-
105
-
106
-
107
-
108
-
109
-
110
-
111
-
112
-
113
-
114
-
115
-
116
-
117
-
118
-
119
-
120
-
121
-
122
-
123
-
124
-
125
-
126
-
127
-
128
-
129
-
130
-
131
-
132
-
133
-
134
-
135
-
136
-
137
-
138
-
139
-
140
-
141
-
142
-
143
-
144
-
145
-
146
-
147
-
148
-
149
-
150
-
151
-
152
-
153
-
154
-
155
-
156
-
157
-
158
-
159
-
160
-
161
-
162
-
163
-
164
-
165
-
166
-
167
-
168
-
169
-
170
-
171
-
172
-
173
-
174
-
175
-
176
-
177
-
178
-
179
-
180
-
181
-
182
-
183
-
184
-
185
-
186
 |
 |
YUM! BRANDS, INC.-2016Proxy Statement44
Proxy Statement
EXECUTIVE COMPENSATION
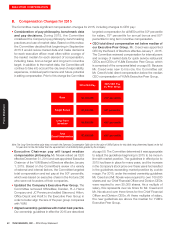
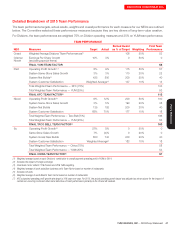
EPS growth during the 2012 - 2014 performance cycle did not reach the required minimum threshold of seven percent
(see discussion of PSUs at page 48).
Total Value Granted(1) 3-Year EPS
CAGR Target
3-Year EPS
CAGR Actual Realized Value
$1.6MM 10% 2.5%
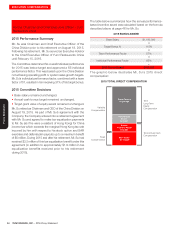
ALL NEO PSU VALUE FOR 2012 – 2014 PERFORMANCE CYCLE
(1) Amount is the sum of the grant date values awarded to each NEO as follows: Mr.Creed ($240,000), Mr.Novak ($773,000), Mr.Pant ($250,000), and Mr.Su ($385,000).
Mr. Grismer and Mr. Niccol did not receive PSU grants in 2012. Mr. Grismer began participating in the Performance Share Plan in 2013, and Mr.Niccol began
participating in 2015.
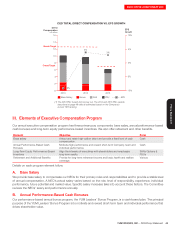
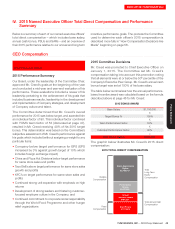
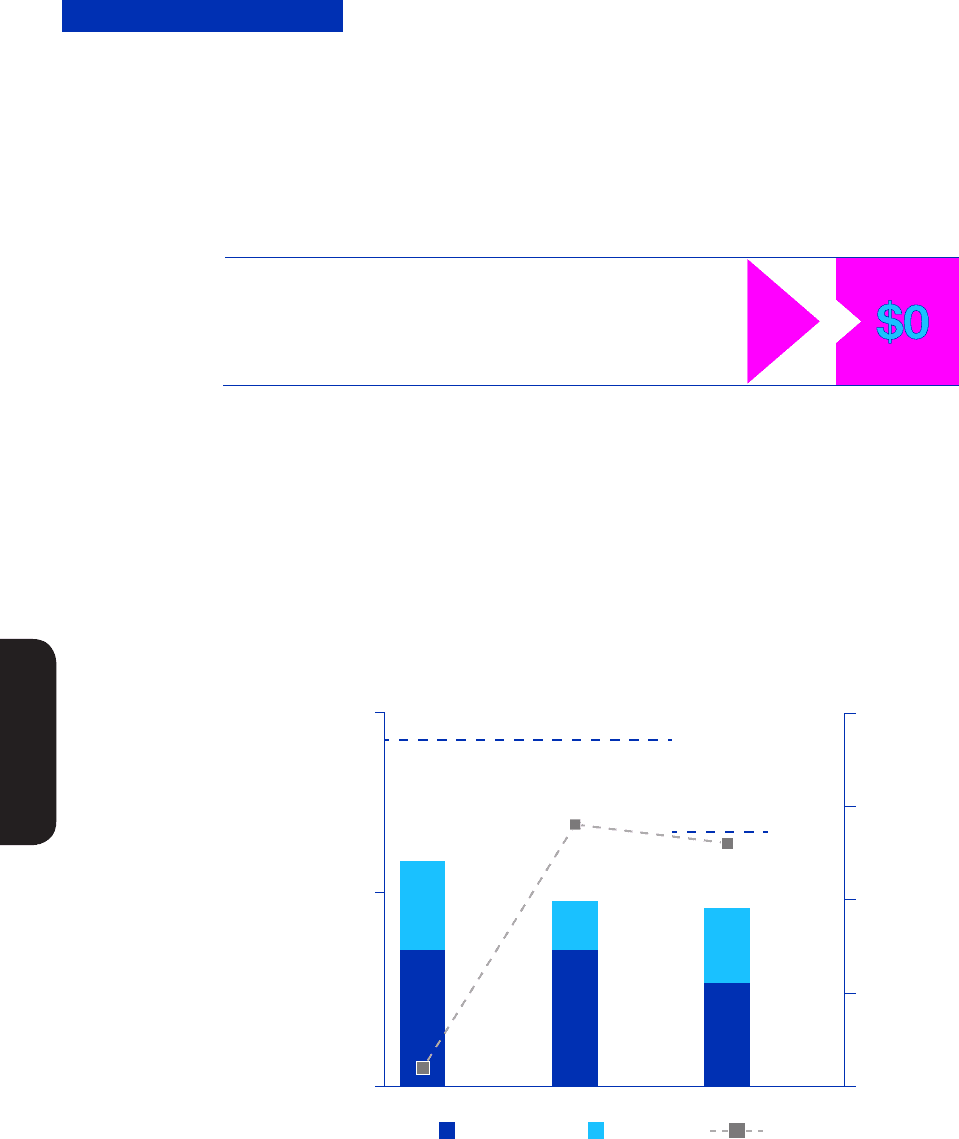
CEO Cash Compensation was Below Target
Our CEO’s cash compensation tracks EPS growth, which is our primary business performance metric. As demonstrated
below, our EPS growth in each of the last three years was below our targets of 10%, 20%, and 10% and resulted in our
CEO’s actual cash compensation being below target.
Cash
Compensation
in $ millions
CEO CASH COMPENSATION VS. EPS GROWTH
EPS
Growth
2013 2014 2015
Base Salary Bonus
4%
3%
EPS
(9%)
-10%
-5
0%
5%
10%
0
2
4
Novak Target
Creed Target
9%
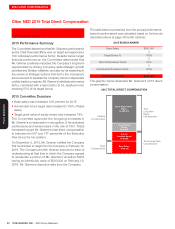
CEO Total Direct Compensation reflects Performance
Similarly with cash compensation, our CEO’s actual direct compensation (comprised of base salary, bonus and annual
long-term incentive value at grant date) for the last three years was below target reflecting the below target performance
of the Company. The SARs award will only provide value to Mr.Novak and Mr.Creed if shareholders receive value through
stock price appreciation, and PSU’s will only pay out if our three-year Total Shareholder Return (“TSR”) hits threshold
performance.