Pizza Hut 2015 Annual Report Download - page 125
Download and view the complete annual report
Please find page 125 of the 2015 Pizza Hut annual report below. You can navigate through the pages in the report by either clicking on the pages listed below, or by using the keyword search tool below to find specific information within the annual report.-
 1
1 -
2
-
3
-
4
-
5
-
6
-
7
-
8
-
9
-
10
-
11
-
12
-
13
-
14
-
15
-
16
-
17
-
18
-
19
-
20
-
21
-
22
-
23
-
24
-
25
-
26
-
27
-
28
-
29
-
30
-
31
-
32
-
33
-
34
-
35
-
36
-
37
-
38
-
39
-
40
-
41
-
42
-
43
-
44
-
45
-
46
-
47
-
48
-
49
-
50
-
51
-
52
-
53
-
54
-
55
-
56
-
57
-
58
-
59
-
60
-
61
-
62
-
63
-
64
-
65
-
66
-
67
-
68
-
69
-
70
-
71
-
72
-
73
-
74
-
75
-
76
-
77
-
78
-
79
-
80
-
81
-
82
-
83
-
84
-
85
-
86
-
87
-
88
-
89
-
90
-
91
-
92
-
93
-
94
-
95
-
96
-
97
-
98
-
99
-
100
-
101
-
102
-
103
-
104
-
105
-
106
-
107
-
108
-
109
-
110
-
111
-
112
-
113
-
114
-
 115
115 -
 116
116 -
 117
117 -
 118
118 -
 119
119 -
 120
120 -
 121
121 -
 122
122 -
 123
123 -
 124
124 -
 125
125 -
 126
126 -
 127
127 -
 128
128 -
 129
129 -
 130
130 -
 131
131 -
 132
132 -
 133
133 -
 134
134 -
 135
135 -
136
-
137
-
138
-
139
-
140
-
141
-
142
-
143
-
144
-
145
-
146
-
147
-
148
-
149
-
150
-
151
-
152
-
153
-
154
-
155
-
156
-
157
-
158
-
159
-
160
-
161
-
162
-
163
-
164
-
165
-
166
-
167
-
168
-
169
-
170
-
171
-
172
-
173
-
174
-
175
-
176
-
177
-
178
-
179
-
180
-
181
-
182
-
183
-
184
-
185
-
186
 |
 |

YUM! BRANDS, INC.-2015 Form10-K 17
Form 10-K
PART II
ITEM7Management’s Discussion and Analysis of Financial Condition and Results of Operations
of YUM in mainland China, with exclusive rights to the KFC, Pizza Hut
and Taco Bell concepts. Upon completion of the planned spin-off, YUM
will become more of a “pure play” franchisor with more stable earnings,
higher profit margins, lower capital requirements and stronger cash flow
conversion. Consistent with this strategy YUM is targeting 96% franchisee
ownership of its restaurants by the end of 2017.
YUM has announced its intention to return substantial capital to shareholders
prior to this planned spin-off, the majority of which will be funded by
incremental borrowings. With this recapitalization, the Company is
transitioning to a non-investment grade credit rating with a balance sheet
more consistent with highly-levered peer restaurant franchise companies.
Moreover, this will allow for an ongoing return-of-capital framework that will
seek to optimize the Company’s long-term growth rate on a per-share basis.
Completion of the spin-off will be subject to certain conditions, including
receiving final approval from the YUM Board of Directors, receipt of
various regulatory approvals, receipt of an opinion of counsel with respect
to certain tax matters, the effectiveness of filings related to public listing
and applicable securities laws, and other terms and conditions as may
be determined by the Board of Directors. There can be no assurance
regarding the ultimate timing of the proposed transaction or that the
transaction will be completed.
Our historical ongoing earnings growth model has targeted a 10% earnings
per share (“EPS”) growth rate, which was based on Operating Profit growth
targets of 15% in China, 10% for our KFC Division, 8% for our Pizza Hut
Division, and 6% for our Taco Bell Division. See the Division discussions
within the Results of Operations section of this MD&A for further details
on our Divisions’ 2015 targets.
YUM’s 2016 Operating Profit is expected to grow 10% in constant currency,
including the impact of 2016 having a 53rd week. While we expect to spin
off our China business prior to the end of 2016, this target assumes our
China business will remain part of YUM through the end of 2016. YUM’s
2016 target is based on Operating Profit growth instead of EPS growth
given the uncertainties surrounding the specific timing and pricing of our
2016 shareholder capital returns.
Subsequent to the spin-off of our China business, we are targeting about
15% ongoing EPS growth for the new China entity and about 15% ongoing
total shareholder return for the remaining ongoing YUM business. The new
China entity’s 15% EPS growth includes contributions from both Operating
Profit and financial strategies such as share repurchases. YUM’s 15%
total shareholder return includes ongoing Operating Profit growth targets
of 10% for our KFC Division, 8% for our Pizza Hut Division and 6% for
our Taco Bell Division, which are consistent with our historical ongoing
earnings growth model. The 15% total shareholder return also includes 1%
to 2% growth from the China license fee, 3% to 5% growth from financial
strategies and approximately 2% yield from dividends.
We intend for this MD&A to provide the reader with information that will assist
in understanding our results of operations, including performance metrics
that management uses to assess the Company’s performance. Throughout
this MD&A, we commonly discuss the following performance metrics:
•
The Company provides certain percentage changes excluding the
impact of foreign currency translation (“FX” or “Forex”). These amounts
are derived by translating current year results at prior year average
exchange rates. We believe the elimination of the foreign currency
translation impact provides better year-to-year comparability without
the distortion of foreign currency fluctuations.
•
System sales growth includes the results of all restaurants regardless
of ownership, including company-owned, franchise, unconsolidated
affiliate and license restaurants that operate our Concepts, except for
non-company-owned restaurants for which we do not receive a sales-
based royalty. Sales of franchise, unconsolidated affiliate and license
restaurants typically generate ongoing franchise and license fees for
the Company at a rate of 4% to 6% of sales. Franchise, unconsolidated
affiliate and license restaurant sales are not included in Company sales
on the Consolidated Statements of Income; however, the franchise and
license fees are included in the Company’s revenues. We believe system
sales growth is useful to investors as a significant indicator of the overall
strength of our business as it incorporates all of our revenue drivers,
Company and franchise same-store sales as well as net unit growth.
•
Same-store sales growth is the estimated percentage change in sales
of all restaurants that have been open and in the YUM system one
year or more.
•
Company Restaurant profit (“Restaurant profit”) is defined as Company
sales less expenses incurred directly by our Company-owned restaurants
in generating Company sales. Company restaurant margin as a percentage
of sales is defined as Restaurant profit divided by Company sales. Within
the Company Sales and Restaurant Profit analysis, Store Portfolio
Actions represent the net impact of new unit openings, acquisitions,
refranchising and store closures, and Other primarily represents the
impact of same-store sales as well as the impact of changes in costs
such as inflation/deflation.
•
In addition to the results provided in accordance with U.S. Generally
Accepted Accounting Principles (“GAAP”) throughout this MD&A, the
Company provides non-GAAP measurements which present operating
results on a basis before Special Items. The Company uses earnings
before Special Items as a key performance measure of results of
operations for the purpose of evaluating performance internally and
Special Items are not included in any of our segment results. This
non-GAAP measurement is not intended to replace the presentation
of our financial results in accordance with GAAP. Rather, the Company
believes that the presentation of earnings before Special Items provides
additional information to investors to facilitate the comparison of past
and present results, excluding those items that the Company does
not believe are indicative of our ongoing operations due to their size
and/or nature.
•
All Note references herein refer to the Notes to the Financial Statements.
Tabular amounts are displayed in millions of U.S. dollars except per
share and unit count amounts, or as otherwise specifically identified.
Percentages may not recompute due to rounding.
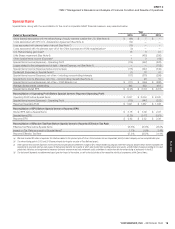
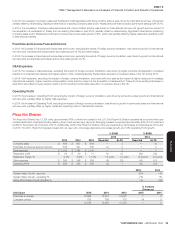
Results of Operations
Summary
All comparisons within this summary are versus the same period a year
ago and exclude the impact of Special Items. All system sales growth
and Operating Profit comparisons exclude the impact of foreign currency.
2015 diluted EPS increased 3% to $3.18 per share versus our target of
10% growth, as sales and profits at our China Division did not recover as
strongly as expected and adverse foreign currency translation significantly
impacted reported earnings.
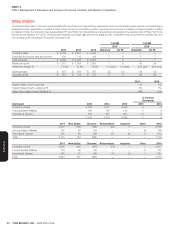
We expected China Division sales and profits to grow significantly in the
second half of 2015 as we recovered from the adverse publicity in July
2014 surrounding improper food handling practices of a former supplier.
China Division sales initially turned significantly positive as we lapped the
July 2014 supplier incident, but overall sales in the second half of 2015
trailed our expectations, particularly at Pizza Hut Casual Dining. KFC China
grew same stores sales 3% in Q3 and 6% in Q4, while Pizza Hut Casual
Dining same-store sales declined 1% in Q3 and 8% in Q4. For the year
China Division same-store sales declined 4%.