Pizza Hut 2015 Annual Report Download - page 57
Download and view the complete annual report
Please find page 57 of the 2015 Pizza Hut annual report below. You can navigate through the pages in the report by either clicking on the pages listed below, or by using the keyword search tool below to find specific information within the annual report.-
 1
1 -
2
-
3
-
4
-
5
-
6
-
7
-
8
-
9
-
10
-
11
-
12
-
13
-
14
-
15
-
16
-
17
-
18
-
19
-
20
-
21
-
22
-
23
-
24
-
25
-
26
-
27
-
28
-
29
-
30
-
31
-
32
-
33
-
34
-
35
-
36
-
37
-
38
-
39
-
40
-
41
-
42
-
43
-
44
-
45
-
46
-
 47
47 -
 48
48 -
 49
49 -
 50
50 -
 51
51 -
 52
52 -
 53
53 -
 54
54 -
 55
55 -
 56
56 -
 57
57 -
 58
58 -
 59
59 -
 60
60 -
 61
61 -
 62
62 -
 63
63 -
 64
64 -
 65
65 -
 66
66 -
 67
67 -
68
-
69
-
70
-
71
-
72
-
73
-
74
-
75
-
76
-
77
-
78
-
79
-
80
-
81
-
82
-
83
-
84
-
85
-
86
-
87
-
88
-
89
-
90
-
91
-
92
-
93
-
94
-
95
-
96
-
97
-
98
-
99
-
100
-
101
-
102
-
103
-
104
-
105
-
106
-
107
-
108
-
109
-
110
-
111
-
112
-
113
-
114
-
115
-
116
-
117
-
118
-
119
-
120
-
121
-
122
-
123
-
124
-
125
-
126
-
127
-
128
-
129
-
130
-
131
-
132
-
133
-
134
-
135
-
136
-
137
-
138
-
139
-
140
-
141
-
142
-
143
-
144
-
145
-
146
-
147
-
148
-
149
-
150
-
151
-
152
-
153
-
154
-
155
-
156
-
157
-
158
-
159
-
160
-
161
-
162
-
163
-
164
-
165
-
166
-
167
-
168
-
169
-
170
-
171
-
172
-
173
-
174
-
175
-
176
-
177
-
178
-
179
-
180
-
181
-
182
-
183
-
184
-
185
-
186
 |
 |

YUM! BRANDS, INC.-2016Proxy Statement 43
Proxy Statement
EXECUTIVE COMPENSATION
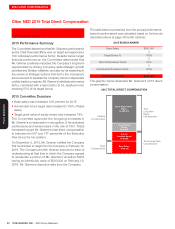
C. Relationship between Company Pay and Performance
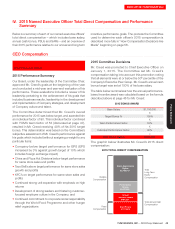
To focus on both the short and long-term success of the Company, our NEOs’ target compensation includes a significant
portion, approximately 80%, that is “at-risk” pay, where the compensation paid is determined based on Company results.
If short-term and long-term financial and operational target goals are not achieved, then performance-related compensation
will decrease. If target goals are exceeded, then performance-related compensation will increase. As demonstrated below,
our target pay mix for NEOs emphasizes our commitment to “at-risk” pay in order to tie pay to performance.
4MAR201521365491
CEO TARGET PAY MIX—2015 ALL OTHER NEO TARGET PAY MIX—2015
Base Salary
23%
Annual Bonus
24%
84%
Long-Term
Equity Incentive
At-Risk
At-Risk
53%
77%
Annual Bonus
23%
Base Salary
16%
Long-Term
Equity Incentive
61%
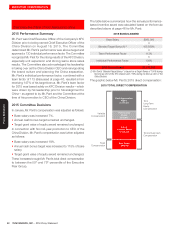
Annual Bonus reflects 2015 Performance
The NEOs annual performance reflects the results of the business that the NEO was leading. For Messrs. Creed, Grismer
and Novak, annual performance is tied to that of YUM. For the other NEOs, annual performance is weighted 75% for the
business that each NEO was leading and 25% for YUM performance. Therefore, bonus payouts for Messrs. Creed,
Grismer, Novak and Su were all below target. Two NEOs received above target bonuses: Mr.Pant, whose compensation
reflects the strong performance of the KFC Division where he was the CEO for over half the year and Mr.Niccol, who led
the Taco Bell Division to perform significantly above target on all performancemetrics.
NEO ACTUAL BONUS VS. TARGET
CREED
Actual (%)
NOVAK
Target
Bonus
48% 53%
147%
NICCOL SU
53%
GRISMER
240%
PANT
37%
PSU Awards did not Pay Out in 2015
Long-term incentive grants are valued based on grant date value and are meant to be incentive opportunities based on
future performance. Therefore, values in the Summary Compensation Table do not represent the value that may ultimately
be realized by the executive. Realized value will be determined by actual performance over succeeding years. This means
that, consistent with our pay-for performance philosophy, in the case of SARs/Options, our stock price must increase
and, in the case of PSUs, we must attain certain performance thresholds before our executives realize any value. As shown
below, our 2012 PSU award under our Performance Share Plan did not pay out to our NEOs in 2015 since the Company’s