Pizza Hut 2015 Annual Report Download - page 159
Download and view the complete annual report
Please find page 159 of the 2015 Pizza Hut annual report below. You can navigate through the pages in the report by either clicking on the pages listed below, or by using the keyword search tool below to find specific information within the annual report.-
 1
1 -
2
-
3
-
4
-
5
-
6
-
7
-
8
-
9
-
10
-
11
-
12
-
13
-
14
-
15
-
16
-
17
-
18
-
19
-
20
-
21
-
22
-
23
-
24
-
25
-
26
-
27
-
28
-
29
-
30
-
31
-
32
-
33
-
34
-
35
-
36
-
37
-
38
-
39
-
40
-
41
-
42
-
43
-
44
-
45
-
46
-
47
-
48
-
49
-
50
-
51
-
52
-
53
-
54
-
55
-
56
-
57
-
58
-
59
-
60
-
61
-
62
-
63
-
64
-
65
-
66
-
67
-
68
-
69
-
70
-
71
-
72
-
73
-
74
-
75
-
76
-
77
-
78
-
79
-
80
-
81
-
82
-
83
-
84
-
85
-
86
-
87
-
88
-
89
-
90
-
91
-
92
-
93
-
94
-
95
-
96
-
97
-
98
-
99
-
100
-
101
-
102
-
103
-
104
-
105
-
106
-
107
-
108
-
109
-
110
-
111
-
112
-
113
-
114
-
115
-
116
-
117
-
118
-
119
-
120
-
121
-
122
-
123
-
124
-
125
-
126
-
127
-
128
-
129
-
130
-
131
-
132
-
133
-
134
-
135
-
136
-
137
-
138
-
139
-
140
-
141
-
142
-
143
-
144
-
145
-
146
-
147
-
148
-
 149
149 -
 150
150 -
 151
151 -
 152
152 -
 153
153 -
 154
154 -
 155
155 -
 156
156 -
 157
157 -
 158
158 -
 159
159 -
 160
160 -
 161
161 -
 162
162 -
 163
163 -
 164
164 -
 165
165 -
 166
166 -
 167
167 -
 168
168 -
 169
169 -
170
-
171
-
172
-
173
-
174
-
175
-
176
-
177
-
178
-
179
-
180
-
181
-
182
-
183
-
184
-
185
-
186
 |
 |
YUM! BRANDS, INC.-2015 Form10-K 51
Form 10-K
PART II
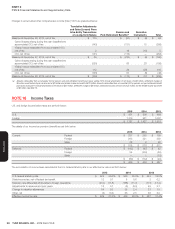
ITEM 8Financial Statements and Supplementary Data
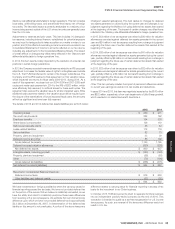
The annual maturities of short-term borrowings and long-term debt as of December 26, 2015, excluding capital lease obligations of $169 million and fair value
hedge accounting adjustments of $1 million, are as follows:
Year ended:
2016 $ 909
2017 701
2018 325
2019 250
2020 350
Thereafter 1,275
Total $ 3,810
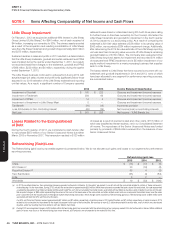
Interest expense on short-term borrowings and long-term debt was $155 million, $152 million and $270 million in 2015, 2014 and 2013, respectively.
2013 included $118 million in losses recorded in Interest expense, net as a result of premiums paid and other costs related to the extinguishment of
debt. See Losses Related to the Extinguishment of Debt section of Note 4 for further discussion.
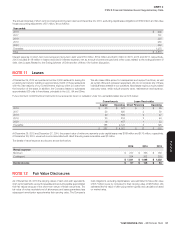
NOTE11 Leases
At December 26, 2015 we operated more than 8,900 restaurants, leasing the
underlying land and/or building in approximately 8,025 of those restaurants
with the vast majority of our commitments expiring within 20 years from
the inception of the lease. In addition, the Company leases or subleases
approximately 825 units to franchisees, principally in the U.S., UK and China.
We also lease office space for headquarters and support functions, as well
as certain office and restaurant equipment. We do not consider any of these
individual leases material to our operations. Most leases require us to pay related
executory costs, which include property taxes, maintenance and insurance.
Future minimum commitments and amounts to be received as lessor or sublessor under non-cancelable leases are set forth below:
Commitments Lease Receivables
Capital Operating Direct Financing Operating
2016 $ 20 $ 672 $ 2 $ 55
2017 20 620 2 50
2018 20 569 2 47
2019 20 516 2 40
2020 19 457 1 33
Thereafter 188 2,123 3 125
$ 287 $ 4,957 $ 12 $ 350
At December 26, 2015 and December 27, 2014, the present value of minimum payments under capital leases was $169 million and $175 million, respectively.
At December 26, 2015, unearned income associated with direct financing lease receivables was $3 million.
The details of rental expense and income are set forth below:
2015 2014 2013
Rental expense
Minimum $ 737 $ 766 $ 759
Contingent 294 302 293
$ 1,031 $ 1,068 $ 1,052
Rental income $ 97 $ 103 $ 94
NOTE12 Fair Value Disclosures
As of December 26, 2015 the carrying values of cash and cash equivalents,
short-term investments, accounts receivable and accounts payable approximated
their fair values because of the short-term nature of these instruments. The
fair value of notes receivable net of allowances and lease guarantees less
subsequent amortization approximates their carrying value. The Company’s
debt obligations, excluding capital leases, were estimated to have a fair value
of $3.7 billion (Level 2), compared to their carrying value of $3.8 billion. We
estimated the fair value of debt using market quotes and calculations based
on market rates.