Pizza Hut 2015 Annual Report Download - page 155
Download and view the complete annual report
Please find page 155 of the 2015 Pizza Hut annual report below. You can navigate through the pages in the report by either clicking on the pages listed below, or by using the keyword search tool below to find specific information within the annual report.-
 1
1 -
2
-
3
-
4
-
5
-
6
-
7
-
8
-
9
-
10
-
11
-
12
-
13
-
14
-
15
-
16
-
17
-
18
-
19
-
20
-
21
-
22
-
23
-
24
-
25
-
26
-
27
-
28
-
29
-
30
-
31
-
32
-
33
-
34
-
35
-
36
-
37
-
38
-
39
-
40
-
41
-
42
-
43
-
44
-
45
-
46
-
47
-
48
-
49
-
50
-
51
-
52
-
53
-
54
-
55
-
56
-
57
-
58
-
59
-
60
-
61
-
62
-
63
-
64
-
65
-
66
-
67
-
68
-
69
-
70
-
71
-
72
-
73
-
74
-
75
-
76
-
77
-
78
-
79
-
80
-
81
-
82
-
83
-
84
-
85
-
86
-
87
-
88
-
89
-
90
-
91
-
92
-
93
-
94
-
95
-
96
-
97
-
98
-
99
-
100
-
101
-
102
-
103
-
104
-
105
-
106
-
107
-
108
-
109
-
110
-
111
-
112
-
113
-
114
-
115
-
116
-
117
-
118
-
119
-
120
-
121
-
122
-
123
-
124
-
125
-
126
-
127
-
128
-
129
-
130
-
131
-
132
-
133
-
134
-
135
-
136
-
137
-
138
-
139
-
140
-
141
-
142
-
143
-
144
-
 145
145 -
 146
146 -
 147
147 -
 148
148 -
 149
149 -
 150
150 -
 151
151 -
 152
152 -
 153
153 -
 154
154 -
 155
155 -
 156
156 -
 157
157 -
 158
158 -
 159
159 -
 160
160 -
 161
161 -
 162
162 -
 163
163 -
 164
164 -
 165
165 -
166
-
167
-
168
-
169
-
170
-
171
-
172
-
173
-
174
-
175
-
176
-
177
-
178
-
179
-
180
-
181
-
182
-
183
-
184
-
185
-
186
 |
 |

YUM! BRANDS, INC.-2015 Form10-K 47
Form 10-K
PART II
ITEM 8Financial Statements and Supplementary Data
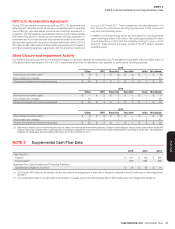
KFC U.S. Acceleration Agreement
During 2015 we reached an agreement with our KFC U.S. franchisees that
gave us brand marketing control as well as an accelerated path to expanded
menu offerings, improved assets and enhanced customer experience. In
connection with this agreement we anticipate investing a total of approximately
$125 million through 2017 primarily to fund new back-of-house equipment for
franchisees and to provide incentives to accelerate franchisee store remodels.
We recorded expenses for the portion of these investments made in 2015 of
$71 million and $1 million within Franchise and license expense and Occupancy
and other operating expenses, respectively, with the remaining investments
to occur in 2016 and 2017. These charges are not being allocated to the
KFC Division for performance reporting purposes due to their unique and
long-term brand-building nature.
In addition to the investments above we have agreed to fund incremental
system advertising dollars of $60 million. We funded approximately $10million
of such advertising in 2015 with the remaining funding to occur in 2016
and 2017. These amounts are being recorded in the KFC Division segment
operating results.
Store Closure and Impairment Activity
Store closure (income) costs and Store impairment charges by reportable segment are presented below. These tables exclude $463 million and $295 million of
Little Sheep impairment losses in 2014 and 2013, respectively which were not allocated to any segment for performance reporting purposes.
2015
China KFC Pizza Hut Taco Bell India Worldwide
Store closure (income) costs(a) $ (6) $ 1 $ (2) $ (1) $ — $ (8)
Store impairment charges 70 7 5 4 1 87
Closure and impairment (income) expenses $ 64 $ 8 $ 3 $ 3 $ 1 $ 79
2014
China KFC Pizza Hut Taco Bell India Worldwide
Store closure (income) costs(a) $ — $ 2 $ 1 $ — $ — $ 3
Store impairment charges 54 7 4 3 1 69
Closure and impairment (income) expenses $ 54 $ 9 $ 5 $ 3 $ 1 $ 72
2013
China KFC Pizza Hut Taco Bell India Worldwide
Store closure (income) costs(a) $ (1) $ (1) $ (3) $ — $ — $ (5)
Store impairment charges 31 4 3 1 2 41
Closure and impairment (income) expenses $ 30 $ 3 $ — $ 1 $ 2 $ 36
(a) Store closure (income) costs include the net gain or loss on sales of real estate on which we formerly operated a Company-owned restaurant that was closed, lease reserves established
when we cease using a property under an operating lease and subsequent adjustments to those reserves and other facility-related expenses from previously closed stores. Remaining lease
obligations for closed stores were not material at December 26, 2015 or December 27, 2014.
NOTE5 Supplemental Cash Flow Data
2015 2014 2013
Cash Paid For:
Interest(a) $ 154 $ 149 $ 269
Income taxes(b) 535 684 489
Significant Non-Cash Investing and Financing Activities:
Capital lease obligations incurred $ 28 $ 24 $ 15
(a) 2013 includes $109 million of cash premiums and fees paid related to the extinguishment of debt, which is the primary component of the $120 million loss on debt extinguishment.
See Note 4.
(b) 2014 includes $200 million of cash paid related to the resolution of a valuation issue with the Internal Revenue Service (“IRS”) related to years 2004 through 2008. See Note 16.