Pizza Hut 2015 Annual Report Download - page 153
Download and view the complete annual report
Please find page 153 of the 2015 Pizza Hut annual report below. You can navigate through the pages in the report by either clicking on the pages listed below, or by using the keyword search tool below to find specific information within the annual report.-
 1
1 -
2
-
3
-
4
-
5
-
6
-
7
-
8
-
9
-
10
-
11
-
12
-
13
-
14
-
15
-
16
-
17
-
18
-
19
-
20
-
21
-
22
-
23
-
24
-
25
-
26
-
27
-
28
-
29
-
30
-
31
-
32
-
33
-
34
-
35
-
36
-
37
-
38
-
39
-
40
-
41
-
42
-
43
-
44
-
45
-
46
-
47
-
48
-
49
-
50
-
51
-
52
-
53
-
54
-
55
-
56
-
57
-
58
-
59
-
60
-
61
-
62
-
63
-
64
-
65
-
66
-
67
-
68
-
69
-
70
-
71
-
72
-
73
-
74
-
75
-
76
-
77
-
78
-
79
-
80
-
81
-
82
-
83
-
84
-
85
-
86
-
87
-
88
-
89
-
90
-
91
-
92
-
93
-
94
-
95
-
96
-
97
-
98
-
99
-
100
-
101
-
102
-
103
-
104
-
105
-
106
-
107
-
108
-
109
-
110
-
111
-
112
-
113
-
114
-
115
-
116
-
117
-
118
-
119
-
120
-
121
-
122
-
123
-
124
-
125
-
126
-
127
-
128
-
129
-
130
-
131
-
132
-
133
-
134
-
135
-
136
-
137
-
138
-
139
-
140
-
141
-
142
-
 143
143 -
 144
144 -
 145
145 -
 146
146 -
 147
147 -
 148
148 -
 149
149 -
 150
150 -
 151
151 -
 152
152 -
 153
153 -
 154
154 -
 155
155 -
 156
156 -
 157
157 -
 158
158 -
 159
159 -
 160
160 -
 161
161 -
 162
162 -
 163
163 -
164
-
165
-
166
-
167
-
168
-
169
-
170
-
171
-
172
-
173
-
174
-
175
-
176
-
177
-
178
-
179
-
180
-
181
-
182
-
183
-
184
-
185
-
186
 |
 |

YUM! BRANDS, INC.-2015 Form10-K 45
Form 10-K
PART II
ITEM 8Financial Statements and Supplementary Data
As a result of the use of derivative instruments, the Company is exposed
to risk that the counterparties will fail to meet their contractual obligations.
To mitigate the counterparty credit risk, we only enter into contracts with
carefully selected major financial institutions based upon their credit
ratings and other factors, and continually assess the creditworthiness of
counterparties. At December 26, 2015 and December 27, 2014, all of
the counterparties to our interest rate swaps, foreign currency swaps and
foreign currency forwards had investment grade ratings according to the
three major ratings agencies. To date, all counterparties have performed
in accordance with their contractual obligations.
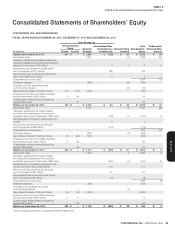
Common Stock Share Repurchases. From time to time, we repurchase
shares of our Common Stock under share repurchase programs authorized
by our Board of Directors. Shares repurchased constitute authorized,
but unissued shares under the North Carolina laws under which we are
incorporated. Additionally, our Common Stock has no par or stated value.
Accordingly, we record the full value of share repurchases, upon the trade
date, against Common Stock on our Consolidated Balance Sheet except
when to do so would result in a negative balance in such Common Stock
account. In such instances, on a period basis, we record the cost of any
further share repurchases as a reduction in retained earnings. Due to the
large number of share repurchases of our stock over the past several
years, our Common Stock balance is frequently zero at the end of any
period. Accordingly, $1,124 million, $725 million and $640 million in share
repurchases were recorded as a reduction in Retained Earnings in 2015,
2014 and 2013, respectively. See Note 15 for additional information on
our share repurchases.
Pension and Post-retirement Medical Benefits. We measure and recognize
the overfunded or underfunded status of our pension and post-retirement
plans as an asset or liability in our Consolidated Balance Sheet as of our
fiscal year end. The funded status represents the difference between the
projected benefit obligations and the fair value of plan assets, which is
calculated on a plan-by-plan basis. The projected benefit obligation and
related funded status are determined using assumptions as of the end of
each year. The projected benefit obligation is the present value of benefits
earned to date by plan participants, including the effect of future salary
increases, as applicable. The difference between the projected benefit
obligations and the fair value of plan assets that has not previously been
recognized in our Consolidated Statement of Income is recorded as a
component of Accumulated other comprehensive income (loss).
The net periodic benefit costs associated with the Company’s defined
benefit pension and post-retirement medical plans are determined using
assumptions regarding the projected benefit obligation and, for funded
plans, the market-related value of plan assets as of the beginning of each
year. We have elected to use a market-related value of plan assets to
calculate the expected return on assets in net periodic benefit costs. We
recognize differences in the fair value versus the market-related value of
plan assets evenly over five years. For each individual plan we amortize into
pension expense the net amounts in Accumulated other comprehensive
income (loss), as adjusted for the difference between the fair value and
market-related value of plan assets, to the extent that such amounts
exceed 10% of the greater of a plan’s projected benefit obligation or
market-related value of assets, over the remaining service period of active
participants in the plan or, for plans with no active participants, over the
expected average life expectancy of the inactive participants in the plan.
We record a curtailment when an event occurs that significantly reduces
the expected years of future service or eliminates the accrual of defined
benefits for the future services of a significant number of employees. We
record a curtailment gain when the employees who are entitled to the
benefits terminate their employment; we record a curtailment loss when
it becomes probable a loss will occur.
We recognize settlement gains or losses only when we have determined
that the cost of all settlements in a year will exceed the sum of the service
and interest costs within an individual plan.
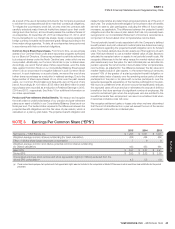
NOTE3 Earnings Per Common Share (“EPS”)
2015 2014 2013
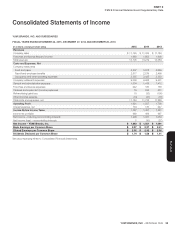
Net Income – YUM! Brands, Inc. $ 1,293 $ 1,051 $ 1,091
Weighted-average common shares outstanding (for basic calculation) 436 444 452
Effect of dilutive share-based employee compensation 7 9 9
Weighted-average common and dilutive potential common shares outstanding
(for diluted calculation) 443 453 461
Basic EPS $ 2.97 $ 2.37 $ 2.41
Diluted EPS $ 2.92 $ 2.32 $ 2.36
Unexercised employee stock options and stock appreciation rights (in millions) excluded from the
diluted EPS computation(a) 4.5 5.5 4.9
(a) These unexercised employee stock options and stock appreciation rights were not included in the computation of diluted EPS because to do so would have been antidilutive for the periods
presented.