Pizza Hut 2015 Annual Report Download - page 60
Download and view the complete annual report
Please find page 60 of the 2015 Pizza Hut annual report below. You can navigate through the pages in the report by either clicking on the pages listed below, or by using the keyword search tool below to find specific information within the annual report.-
 1
1 -
2
-
3
-
4
-
5
-
6
-
7
-
8
-
9
-
10
-
11
-
12
-
13
-
14
-
15
-
16
-
17
-
18
-
19
-
20
-
21
-
22
-
23
-
24
-
25
-
26
-
27
-
28
-
29
-
30
-
31
-
32
-
33
-
34
-
35
-
36
-
37
-
38
-
39
-
40
-
41
-
42
-
43
-
44
-
45
-
46
-
47
-
48
-
49
-
 50
50 -
 51
51 -
 52
52 -
 53
53 -
 54
54 -
 55
55 -
 56
56 -
 57
57 -
 58
58 -
 59
59 -
 60
60 -
 61
61 -
 62
62 -
 63
63 -
 64
64 -
 65
65 -
 66
66 -
 67
67 -
 68
68 -
 69
69 -
 70
70 -
71
-
72
-
73
-
74
-
75
-
76
-
77
-
78
-
79
-
80
-
81
-
82
-
83
-
84
-
85
-
86
-
87
-
88
-
89
-
90
-
91
-
92
-
93
-
94
-
95
-
96
-
97
-
98
-
99
-
100
-
101
-
102
-
103
-
104
-
105
-
106
-
107
-
108
-
109
-
110
-
111
-
112
-
113
-
114
-
115
-
116
-
117
-
118
-
119
-
120
-
121
-
122
-
123
-
124
-
125
-
126
-
127
-
128
-
129
-
130
-
131
-
132
-
133
-
134
-
135
-
136
-
137
-
138
-
139
-
140
-
141
-
142
-
143
-
144
-
145
-
146
-
147
-
148
-
149
-
150
-
151
-
152
-
153
-
154
-
155
-
156
-
157
-
158
-
159
-
160
-
161
-
162
-
163
-
164
-
165
-
166
-
167
-
168
-
169
-
170
-
171
-
172
-
173
-
174
-
175
-
176
-
177
-
178
-
179
-
180
-
181
-
182
-
183
-
184
-
185
-
186
 |
 |

YUM! BRANDS, INC.-2016Proxy Statement46
Proxy Statement
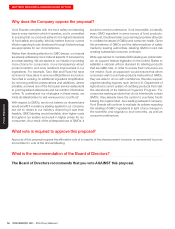
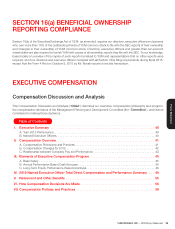
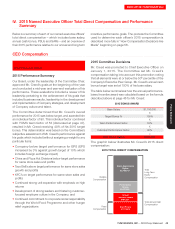
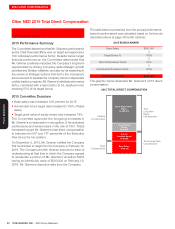
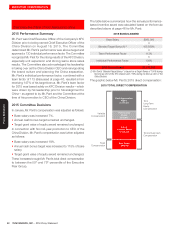
EXECUTIVE COMPENSATION
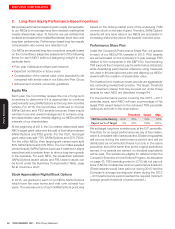
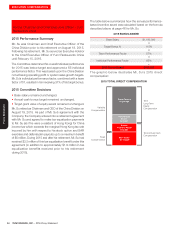
The formula for calculating the performance-based annual bonus under the YUM Leaders’ Bonus Program is the product
of the following:
Base Salary
X
Target Bonus
Percentage
X
Team Performance
(0 – 200%)
X
Individual Performance
(0 – 150%)
=
Bonus Payout
(0 – 300%)
Team Performance
The Committee established team performance measures,
targets and weights in January 2015 after receiving input
and recommendations from management. The objectives
were also reviewed by the Board to ensure the goals support
the Company’s overall strategic objectives.
The performance objectives were developed through the
Company’s annual financial planning process, which takes
into account Division growth strategies, historical
performance, and the expected future operating environment.
These projections included profit growth to achieve our
EPS growth target.
When setting targets for each specific team performance
measure, the Company takes into account overall business
goals and structures the target to motivate achievement of
desired performance consistent with our growth commitment
to shareholders.
A leverage formula for each team performance measure
magnifies the potential impact that performance above or
below the performance target will have on the calculation
of the annual bonus. This leverage increases the payouts
when targets are exceeded and reduces payouts when
performance is below target. There is a threshold level of
performance for all measures that must be met in order for
any bonus to be paid. Additionally, all measures have a cap
on the level of performance over which no additional bonus
will be paid regardless of performance above the cap.
The performance targets are comparable to those we
disclose to our investors and, when determined to be
appropriate by our Committee, may be slightly above or
below disclosed guidance. Division targets may be adjusted
during the year when doing so is consistent with the
objectives and intent at the time the targets were originallyset.