PG&E 2010 Annual Report Download - page 96
Download and view the complete annual report
Please find page 96 of the 2010 PG&E annual report below. You can navigate through the pages in the report by either clicking on the pages listed below, or by using the keyword search tool below to find specific information within the annual report.-
 1
1 -
2
-
3
-
4
-
5
-
6
-
7
-
8
-
9
-
10
-
11
-
12
-
13
-
14
-
15
-
16
-
17
-
18
-
19
-
20
-
21
-
22
-
23
-
24
-
25
-
26
-
27
-
28
-
29
-
30
-
31
-
32
-
33
-
34
-
35
-
36
-
37
-
38
-
39
-
40
-
41
-
42
-
43
-
44
-
45
-
46
-
47
-
48
-
49
-
50
-
51
-
52
-
53
-
54
-
55
-
56
-
57
-
58
-
59
-
60
-
61
-
62
-
63
-
64
-
65
-
66
-
67
-
68
-
69
-
70
-
71
-
72
-
73
-
74
-
75
-
76
-
77
-
78
-
79
-
80
-
81
-
82
-
83
-
84
-
85
-
 86
86 -
 87
87 -
 88
88 -
 89
89 -
 90
90 -
 91
91 -
 92
92 -
 93
93 -
 94
94 -
 95
95 -
 96
96 -
 97
97 -
 98
98 -
 99
99 -
 100
100 -
 101
101 -
 102
102 -
 103
103 -
 104
104 -
 105
105 -
 106
106 -
107
-
108
-
109
-
110
-
111
-
112
-
113
-
114
-
115
-
116
-
117
-
118
-
119
-
120
-
121
-
122
-
123
-
124
-
125
-
126
-
127
-
128
 |
 |

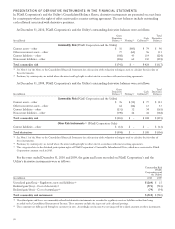
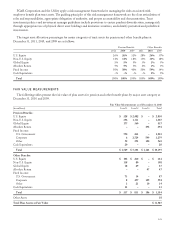
Assets and liabilities measured at fair value on a recurring basis for PG&E Corporation and the Utility are summarized
below (money market investments and assets held in rabbi trusts are held by PG&E Corporation and not the Utility):
Fair Value Measurements at December 31, 2010
(in millions) Level 1 Level 2 Level 3 Total
Assets:
Money market investments $ 138 $ – $ – $ 138
Nuclear decommissioning trusts
U.S. equity securities (1) 1,029 7 – 1,036
Non-U.S. equity securities 349 – – 349
U.S. government and agency securities 584 40 – 624
Municipal securities – 119 – 119
Other fixed income securities –66 – 66
Total nuclear decommissioning trusts (2) 1,962 232 – 2,194
Price risk management instruments (Note 10)
Electric (3) 130 – – 130
Gas (4) 3– – 3
Total price risk management instruments 133 – – 133
Rabbi trusts
Fixed income securities –24 – 24
Life insurance contracts –65 – 65
Total rabbi trusts –89 – 89
Long-term disability trust
U.S. equity securities (1) 11 24 – 35
Corporate debt securities (1) – 150 – 150
Total long-term disability trust 11 174 – 185
Total assets $ 2,244 $ 495 $ – $ 2,739
Liabilities:
Price risk management instruments (Note 10)
Electric (5) $ – $ 5 $ 403 $ 408
Gas (6) – 1 41 42
Total price risk management instruments – 6 444 450
Total liabilities $ – $ 6 $ 444 $ 450
(1) Level 2 balances include commingled funds, which are composed primarily of securities traded publicly on exchanges. Price quotes for the assets
held by the funds are readily observable and available.
(2) Excludes $185 million primarily related to deferred taxes on appreciation of investment value.
(3) Balances include the impact of netting adjustments of $359 million to Level 1. Includes natural gas for electric portfolio.
(4) Balances include the impact of netting adjustments of $44 million to Level 1. Includes natural gas for core customers.
(5) Balances include the impact of netting adjustments of $66 million to Level 2 and $(48) million to Level 3. Includes natural gas for electric portfolio.
(6) Balances include the impact of netting adjustments of $3 million to Level 3. Includes natural gas for core customers.
92