PG&E 2010 Annual Report Download - page 90
Download and view the complete annual report
Please find page 90 of the 2010 PG&E annual report below. You can navigate through the pages in the report by either clicking on the pages listed below, or by using the keyword search tool below to find specific information within the annual report.-
 1
1 -
2
-
3
-
4
-
5
-
6
-
7
-
8
-
9
-
10
-
11
-
12
-
13
-
14
-
15
-
16
-
17
-
18
-
19
-
20
-
21
-
22
-
23
-
24
-
25
-
26
-
27
-
28
-
29
-
30
-
31
-
32
-
33
-
34
-
35
-
36
-
37
-
38
-
39
-
40
-
41
-
42
-
43
-
44
-
45
-
46
-
47
-
48
-
49
-
50
-
51
-
52
-
53
-
54
-
55
-
56
-
57
-
58
-
59
-
60
-
61
-
62
-
63
-
64
-
65
-
66
-
67
-
68
-
69
-
70
-
71
-
72
-
73
-
74
-
75
-
76
-
77
-
78
-
79
-
 80
80 -
 81
81 -
 82
82 -
 83
83 -
 84
84 -
 85
85 -
 86
86 -
 87
87 -
 88
88 -
 89
89 -
 90
90 -
 91
91 -
 92
92 -
 93
93 -
 94
94 -
 95
95 -
 96
96 -
 97
97 -
 98
98 -
 99
99 -
 100
100 -
101
-
102
-
103
-
104
-
105
-
106
-
107
-
108
-
109
-
110
-
111
-
112
-
113
-
114
-
115
-
116
-
117
-
118
-
119
-
120
-
121
-
122
-
123
-
124
-
125
-
126
-
127
-
128
 |
 |

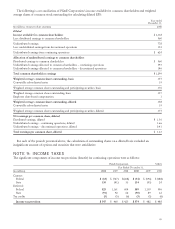
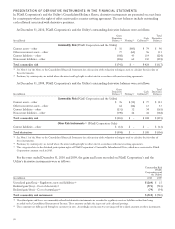
The following describes net deferred income tax liabilities:
PG&E Corporation Utility
Year Ended December 31,
(in millions) 2010 2009 2010 2009
Deferred income tax assets:
Reserve for damages $ 222 $ 138 $ 222 $ 138
Environmental reserve 242 227 242 227
Compensation 345 338 305 304
Net operating loss carry forward 327 –270 –
Other 207 184 178 180
Total deferred income tax assets $ 1,343 $ 887 $ 1,217 $ 849
Deferred income tax liabilities:
Regulatory balancing accounts $ 1,116 $ 1,340 $ 1,116 $ 1,340
Property related basis differences 5,236 4,036 5,234 4,032
Income tax regulatory asset 509 418 509 418
Other 142 157 135 157
Total deferred income tax liabilities $ 7,003 $ 5,951 $ 6,994 $ 5,947
Total net deferred income tax liabilities $ 5,660 $ 5,064 $ 5,777 $ 5,098
Classification of net deferred income tax liabilities:
Included in current liabilities $ 113 $ 332 $ 118 $ 334
Included in noncurrent liabilities 5,547 4,732 5,659 4,764
Total net deferred income tax liabilities $ 5,660 $ 5,064 $ 5,777 $ 5,098
The differences between income taxes and amounts calculated by applying the federal statutory rate to income before
income tax expense for continuing operations were as follows:
PG&E Corporation Utility
Year Ended December 31,
2010 2009 2008 2010 2009 2008
Federal statutory income tax rate 35.0% 35.0% 35.0% 35.0% 35.0% 35.0%
Increase (decrease) in income tax rate resulting from:
State income tax (net of federal benefit) 0.7 1.6 3.1 1.0 1.4 3.3
Effect of regulatory treatment of fixed asset differences (3.1) (2.7) (3.2) (3.0) (2.6) (3.1)
Tax credits (0.4) (0.5) (0.5) (0.4) (0.5) (0.5)
IRS audit settlements 0.1 (4.5) (7.1) (0.2) (4.2) (4.1)
Other, net 0.9 (1.5) (0.9) 1.5 (1.3) (1.7)
Effective tax rate 33.2% 27.4% 26.4% 33.9% 27.8% 28.9%
Unrecognized tax benefits
The following table reconciles the changes in unrecognized tax benefits:
PG&E Corporation Utility
2010 2009 2008 2010 2009 2008
(in millions)
Balance at beginning of year $ 673 $ 75 $ 209 $ 652 $37 $94
Additions for tax position taken during a prior year 27 4–27 4–
Additions for tax position taken during the current year 89 624 43 87 623 20
Settlements (55) (27) (177) (54) (12) (77)
Reductions for tax position taken during a prior year (20) (3) – –––
Balance at end of year $ 714 $ 673 $ 75 $ 712 $ 652 $ 37
86