PG&E 2010 Annual Report Download - page 65
Download and view the complete annual report
Please find page 65 of the 2010 PG&E annual report below. You can navigate through the pages in the report by either clicking on the pages listed below, or by using the keyword search tool below to find specific information within the annual report.-
 1
1 -
2
-
3
-
4
-
5
-
6
-
7
-
8
-
9
-
10
-
11
-
12
-
13
-
14
-
15
-
16
-
17
-
18
-
19
-
20
-
21
-
22
-
23
-
24
-
25
-
26
-
27
-
28
-
29
-
30
-
31
-
32
-
33
-
34
-
35
-
36
-
37
-
38
-
39
-
40
-
41
-
42
-
43
-
44
-
45
-
46
-
47
-
48
-
49
-
50
-
51
-
52
-
53
-
54
-
 55
55 -
 56
56 -
 57
57 -
 58
58 -
 59
59 -
 60
60 -
 61
61 -
 62
62 -
 63
63 -
 64
64 -
 65
65 -
 66
66 -
 67
67 -
 68
68 -
 69
69 -
 70
70 -
 71
71 -
 72
72 -
 73
73 -
 74
74 -
 75
75 -
76
-
77
-
78
-
79
-
80
-
81
-
82
-
83
-
84
-
85
-
86
-
87
-
88
-
89
-
90
-
91
-
92
-
93
-
94
-
95
-
96
-
97
-
98
-
99
-
100
-
101
-
102
-
103
-
104
-
105
-
106
-
107
-
108
-
109
-
110
-
111
-
112
-
113
-
114
-
115
-
116
-
117
-
118
-
119
-
120
-
121
-
122
-
123
-
124
-
125
-
126
-
127
-
128
 |
 |

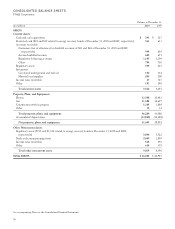
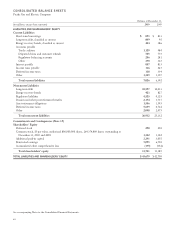
CONSOLIDATED BALANCE SHEETS
Pacific Gas and Electric Company
Balance at December 31,
(in millions) 2010 2009
ASSETS
Current Assets
Cash and cash equivalents $51$ 334
Restricted cash ($38 and $39 related to energy recovery bonds at December
31, 2010 and 2009, respectively) 563 633
Accounts receivable
Customers (net of allowance for doubtful accounts of $81 at
and $68 at December 31, 2010 and 2009, respectively) 944 859
Accrued unbilled revenue 649 671
Regulatory balancing accounts 1,105 1,109
Other 856 751
Regulatory assets 599 427
Inventories
Gas stored underground and fuel oil 152 114
Materials and supplies 205 200
Income taxes receivable 48 138
Other 190 235
Total current assets 5,362 5,471
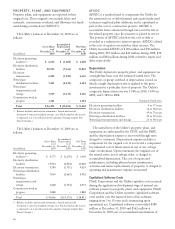
Property, Plant, and Equipment
Electric 33,508 30,481
Gas 11,382 10,697
Construction work in progress 1,384 1,888
Total property, plant, and equipment 46,274 43,066
Accumulated depreciation (14,826) (14,175)
Net property, plant, and equipment 31,448 28,891
Other Noncurrent Assets
Regulatory assets ($735 and $1,124 related to energy recovery bonds at December 31, 2010 and 2009,
respectively) 5,846 5,522
Nuclear decommissioning trusts 2,009 1,899
Income taxes receivable 614 610
Other 400 316
Total other noncurrent assets 8,869 8,347
TOTAL ASSETS $ 45,679 $ 42,709
See accompanying Notes to the Consolidated Financial Statements.
61