PG&E 2010 Annual Report Download - page 89
Download and view the complete annual report
Please find page 89 of the 2010 PG&E annual report below. You can navigate through the pages in the report by either clicking on the pages listed below, or by using the keyword search tool below to find specific information within the annual report.-
 1
1 -
2
-
3
-
4
-
5
-
6
-
7
-
8
-
9
-
10
-
11
-
12
-
13
-
14
-
15
-
16
-
17
-
18
-
19
-
20
-
21
-
22
-
23
-
24
-
25
-
26
-
27
-
28
-
29
-
30
-
31
-
32
-
33
-
34
-
35
-
36
-
37
-
38
-
39
-
40
-
41
-
42
-
43
-
44
-
45
-
46
-
47
-
48
-
49
-
50
-
51
-
52
-
53
-
54
-
55
-
56
-
57
-
58
-
59
-
60
-
61
-
62
-
63
-
64
-
65
-
66
-
67
-
68
-
69
-
70
-
71
-
72
-
73
-
74
-
75
-
76
-
77
-
78
-
 79
79 -
 80
80 -
 81
81 -
 82
82 -
 83
83 -
 84
84 -
 85
85 -
 86
86 -
 87
87 -
 88
88 -
 89
89 -
 90
90 -
 91
91 -
 92
92 -
 93
93 -
 94
94 -
 95
95 -
 96
96 -
 97
97 -
 98
98 -
 99
99 -
100
-
101
-
102
-
103
-
104
-
105
-
106
-
107
-
108
-
109
-
110
-
111
-
112
-
113
-
114
-
115
-
116
-
117
-
118
-
119
-
120
-
121
-
122
-
123
-
124
-
125
-
126
-
127
-
128
 |
 |

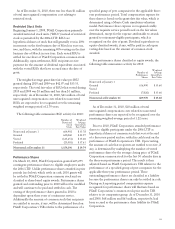
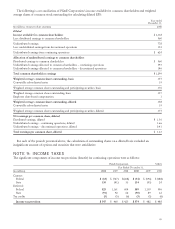
The following is a reconciliation of PG&E Corporation’s income available for common shareholders and weighted
average shares of common stock outstanding for calculating diluted EPS:
Year ended
December 31,
(in millions, except per share amounts) 2008
Diluted
Income available for common shareholders $ 1,338
Less: distributed earnings to common shareholders 560
Undistributed earnings 778
Less: undistributed earnings from discontinued operations 154
Undistributed earnings from continuing operations $ 624
Allocation of undistributed earnings to common shareholders
Distributed earnings to common shareholders $ 560
Undistributed earnings allocated to common shareholders – continuing operations 593
Undistributed earnings allocated to common shareholders – discontinued operations 146
Total common shareholders earnings $ 1,299
Weighted average common shares outstanding, basic 357
Convertible subordinated notes 19
Weighted average common shares outstanding and participating securities, basic 376
Weighted average common shares outstanding, basic 357
Employee share-based compensation 1
Weighted average common shares outstanding, diluted 358
Convertible subordinated notes 19
Weighted average common shares outstanding and participating securities, diluted 377
Net earnings per common share, diluted
Distributed earnings, diluted $ 1.56
Undistributed earnings – continuing operations, diluted 1.66
Undistributed earnings – discontinued operations, diluted 0.41
Total earnings per common share, diluted $ 3.63
For each of the periods presented above, the calculation of outstanding shares on a diluted basis excluded an
insignificant amount of options and securities that were antidilutive.
NOTE 9: INCOME TAXES
The significant components of income tax provision (benefit) for continuing operations were as follows:
PG&E Corporation Utility
Year Ended December 31,
(in millions) 2010 2009 2008 2010 2009 2008
Current:
Federal $ (12) $ (747) $(268) $ (54) $ (696) $ (188)
State 130 (41) 33 134 (45) 24
Deferred:
Federal 525 1,161 604 589 1,139 596
State (91) 92 62 (90) 89 62
Tax credits (5) (5) (6) (5) (5) (6)
Income tax provision $ 547 $ 460 $ 425 $ 574 $ 482 $ 488
85