PG&E 2010 Annual Report Download - page 11
Download and view the complete annual report
Please find page 11 of the 2010 PG&E annual report below. You can navigate through the pages in the report by either clicking on the pages listed below, or by using the keyword search tool below to find specific information within the annual report.-
 1
1 -
 2
2 -
 3
3 -
 4
4 -
 5
5 -
 6
6 -
 7
7 -
 8
8 -
 9
9 -
 10
10 -
 11
11 -
 12
12 -
 13
13 -
 14
14 -
 15
15 -
 16
16 -
 17
17 -
 18
18 -
 19
19 -
 20
20 -
 21
21 -
 22
22 -
23
-
24
-
25
-
26
-
27
-
28
-
29
-
30
-
31
-
32
-
33
-
34
-
35
-
36
-
37
-
38
-
39
-
40
-
41
-
42
-
43
-
44
-
45
-
46
-
47
-
48
-
49
-
50
-
51
-
52
-
53
-
54
-
55
-
56
-
57
-
58
-
59
-
60
-
61
-
62
-
63
-
64
-
65
-
66
-
67
-
68
-
69
-
70
-
71
-
72
-
73
-
74
-
75
-
76
-
77
-
78
-
79
-
80
-
81
-
82
-
83
-
84
-
85
-
86
-
87
-
88
-
89
-
90
-
91
-
92
-
93
-
94
-
95
-
96
-
97
-
98
-
99
-
100
-
101
-
102
-
103
-
104
-
105
-
106
-
107
-
108
-
109
-
110
-
111
-
112
-
113
-
114
-
115
-
116
-
117
-
118
-
119
-
120
-
121
-
122
-
123
-
124
-
125
-
126
-
127
-
128
 |
 |

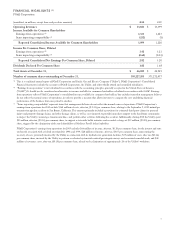
FINANCIAL HIGHLIGHTS (1)
PG&E Corporation
(unaudited, in millions, except share and per share amounts) 2010 2009
Operating Revenues $ 13,841 $ 13,399
Income Available for Common Shareholders
Earnings from operations (2) 1,331 1,223
Items impacting comparability (3) (232) (3)
Reported Consolidated Income Available for Common Shareholders 1,099 1,220
Income Per Common Share, Diluted
Earnings from operations (2) 3.42 3.21
Items impacting comparability (3) (0.60) (0.01)
Reported Consolidated Net Earnings Per Common Share, Diluted 2.82 3.20
Dividends Declared Per Common Share 1.82 1.68
Total Assets at December 31, $ 46,025 $ 42,945
Number of common shares outstanding at December 31, 395,227,205 371,272,457
(1) This is a combined annual report of PG&E Corporation and Pacific Gas and Electric Company (“Utility”). PG&E Corporation’s Consolidated
Financial Statements include the accounts of PG&E Corporation, the Utility, and other wholly owned and controlled subsidiaries.
(2) “Earnings from operations” is not calculated in accordance with the accounting principles generally accepted in the United States of America
(“GAAP”). It should not be considered an alternative to income available for common shareholders calculated in accordance with GAAP. Earnings
from operations reflects PG&E Corporation’s consolidated income available for common shareholders, but excludes items that management believes
do not reflect the normal course of operations, in order to provide a measure that allows investors to compare the core underlying financial
performance of the business from one period to another.
(3) “Items impacting comparability” represent items that management believes do not reflect the normal course of operations. PG&E Corporation’s
earnings from operations for 2010 exclude $168 million of costs, after tax, ($ 0.43) per common share, relating to the September 9, 2010 natural gas
transmission pipeline accident in San Bruno, California. This amount primarily included a provision for estimated third-party claims for personal
injury and property damage claims, and other damage claims, as well as costs incurred to provide immediate support to the San Bruno community,
re-inspect the Utility’s natural gas transmission lines, and perform other activities following the accident. Additionally, during 2010 the Utility spent
$45 million, after-tax, ($0.12) per common share, to support a state-wide ballot initiative and recorded a charge of $19 million, ($0.05) per common
share, triggered by the elimination of the tax deductibility of Medicare Part D federal subsidies.
PG&E Corporation’s earnings from operations for 2009 excludes $66 million of income, after tax, $0.18 per common share, for the interest and state
tax benefit associated with a federal tax refund for 1998 and 1999; $28 million of income, after tax, $0.07 per common share, representing the
recovery of costs previously incurred by the Utility in connection with its hydroelectric generation facilities; $59 million of costs, after tax, ($0.16)
per common share, incurred by the Utility to perform accelerated system-wide natural gas integrity surveys and associated remedial work; and $38
million of severance costs, after-tax, ($0.10) per common share, related to the elimination of approximately 2% of the Utility’s workforce.
7