PG&E 2010 Annual Report Download - page 12
Download and view the complete annual report
Please find page 12 of the 2010 PG&E annual report below. You can navigate through the pages in the report by either clicking on the pages listed below, or by using the keyword search tool below to find specific information within the annual report.-
 1
1 -
 2
2 -
 3
3 -
 4
4 -
 5
5 -
 6
6 -
 7
7 -
 8
8 -
 9
9 -
 10
10 -
 11
11 -
 12
12 -
 13
13 -
 14
14 -
 15
15 -
 16
16 -
 17
17 -
 18
18 -
 19
19 -
 20
20 -
 21
21 -
 22
22 -
23
-
24
-
25
-
26
-
27
-
28
-
29
-
30
-
31
-
32
-
33
-
34
-
35
-
36
-
37
-
38
-
39
-
40
-
41
-
42
-
43
-
44
-
45
-
46
-
47
-
48
-
49
-
50
-
51
-
52
-
53
-
54
-
55
-
56
-
57
-
58
-
59
-
60
-
61
-
62
-
63
-
64
-
65
-
66
-
67
-
68
-
69
-
70
-
71
-
72
-
73
-
74
-
75
-
76
-
77
-
78
-
79
-
80
-
81
-
82
-
83
-
84
-
85
-
86
-
87
-
88
-
89
-
90
-
91
-
92
-
93
-
94
-
95
-
96
-
97
-
98
-
99
-
100
-
101
-
102
-
103
-
104
-
105
-
106
-
107
-
108
-
109
-
110
-
111
-
112
-
113
-
114
-
115
-
116
-
117
-
118
-
119
-
120
-
121
-
122
-
123
-
124
-
125
-
126
-
127
-
128
 |
 |
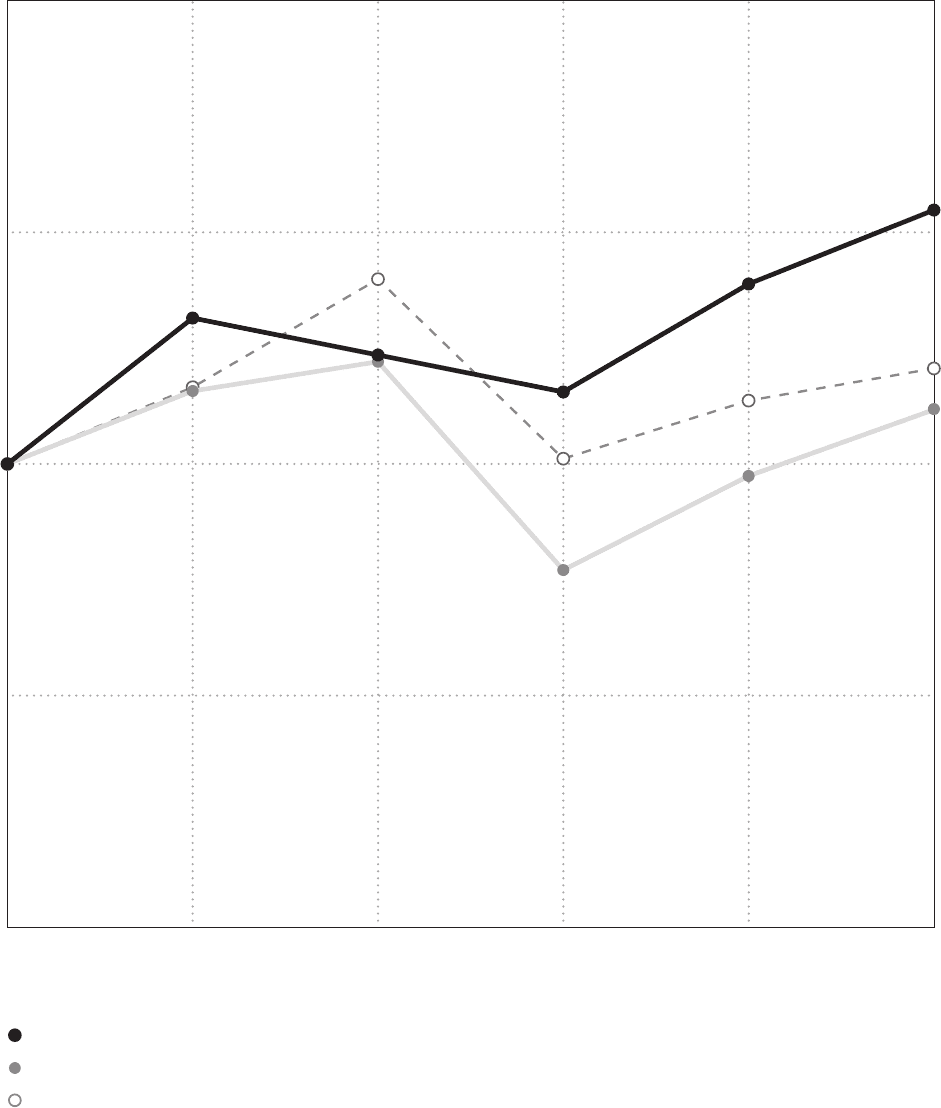
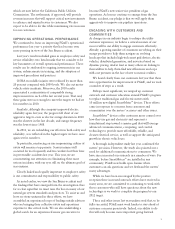
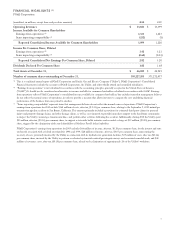
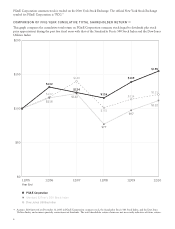
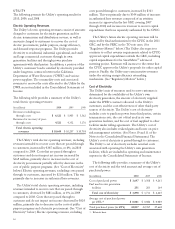
PG&E Corporation common stock is traded on the New York Stock Exchange. The official New York Stock Exchange
symbol for PG&E Corporation is “PCG.”
COMPARISON OF FIVE-YEAR CUMULATIVE TOTAL SHAREHOLDER RETURN (1)
This graph compares the cumulative total return on PG&E Corporation common stock (equal to dividends plus stock
price appreciation) during the past five fiscal years with that of the Standard & Poor’s 500 Stock Index and the Dow Jones
Utilities Index.
$200
$150
$100
$50
$0
Year End
PG&E Corporation
Standard & Poor’s 500 Stock Index
Dow Jones Utilities Index
$117
$101
$140
$114
$121
$116
$122
$77
$97
$112
$132
12/05 12/06 12/07 12/08 12/09 12/10
$124
$116
$139
$155
(1) Assumes $100 invested on December 31, 2005 in PG&E Corporation common stock, the Standard & Poor’s 500 Stock Index, and the Dow Jones
Utilities Index, and assumes quarterly reinvestment of dividends. The total shareholder returns shown are not necessarily indicative of future returns.
8