PG&E 2010 Annual Report Download - page 20
Download and view the complete annual report
Please find page 20 of the 2010 PG&E annual report below. You can navigate through the pages in the report by either clicking on the pages listed below, or by using the keyword search tool below to find specific information within the annual report.-
 1
1 -
2
-
3
-
4
-
5
-
6
-
7
-
8
-
9
-
 10
10 -
 11
11 -
 12
12 -
 13
13 -
 14
14 -
 15
15 -
 16
16 -
 17
17 -
 18
18 -
 19
19 -
 20
20 -
 21
21 -
 22
22 -
 23
23 -
 24
24 -
 25
25 -
 26
26 -
 27
27 -
 28
28 -
 29
29 -
 30
30 -
31
-
32
-
33
-
34
-
35
-
36
-
37
-
38
-
39
-
40
-
41
-
42
-
43
-
44
-
45
-
46
-
47
-
48
-
49
-
50
-
51
-
52
-
53
-
54
-
55
-
56
-
57
-
58
-
59
-
60
-
61
-
62
-
63
-
64
-
65
-
66
-
67
-
68
-
69
-
70
-
71
-
72
-
73
-
74
-
75
-
76
-
77
-
78
-
79
-
80
-
81
-
82
-
83
-
84
-
85
-
86
-
87
-
88
-
89
-
90
-
91
-
92
-
93
-
94
-
95
-
96
-
97
-
98
-
99
-
100
-
101
-
102
-
103
-
104
-
105
-
106
-
107
-
108
-
109
-
110
-
111
-
112
-
113
-
114
-
115
-
116
-
117
-
118
-
119
-
120
-
121
-
122
-
123
-
124
-
125
-
126
-
127
-
128
 |
 |

UTILITY
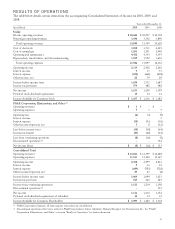
The following presents the Utility’s operating results for
2010, 2009, and 2008.
Electric Operating Revenues
The Utility’s electric operating revenues consist of amounts
charged to customers for electricity generation and for
electric transmission and distribution services, as well as
amounts charged to customers to recover the cost of
electric procurement, public purpose, energy efficiency,
and demand response programs. The Utility provides
electricity to residential, industrial, agricultural, and small
and large commercial customers through its own
generation facilities and through power purchase
agreements with third parties. In addition, a portion of the
Utility’s customers’ load is satisfied by electricity provided
under long-term contracts between the California
Department of Water Resources (“DWR”) and various
power suppliers. The commodity costs and associated
revenues to recover the costs allocated to the Utility by the
DWR are not included in the Consolidated Statements of
Income.
The following table provides a summary of the Utility’s
total electric operating revenues:
(in millions) 2010 2009 2008
Revenues excluding pass-
through costs $ 6,123 $ 5,905 $ 5,562
Revenues for recovery of pass-
through costs 4,521 4,352 5,176
Total electric operating
revenues $ 10,644 $ 10,257 $ 10,738
The Utility’s total electric operating revenues, including
revenues intended to recover costs that are passed through
to customers, increased by $387 million, or 4%, in 2010
compared to 2009. Costs that are passed through to
customers and do not impact net income increased by
$169 million, primarily due to increases in the cost of
electricity procurement partially offset by decreases in the
cost of public purpose programs. (See “Cost of Electricity”
below.) Electric operating revenues, excluding costs passed
through to customers, increased by $218 million. This was
primarily due to increases in authorized base revenues.
The Utility’s total electric operating revenues, including
revenues intended to recover costs that are passed through
to customers, decreased by $481 million, or 4%, in 2009
compared to 2008. Costs that are passed through to
customers and do not impact net income decreased by $824
million, primarily due to decreases in the costs of public
purpose programs and electricity procurement. (See “Cost of
Electricity” below.) Electric operating revenues, excluding
costs passed through to customers, increased by $343
million. This was primarily due to $344 million of increases
in authorized base revenues composed of an attrition
increase (as approved in the last GRC covering 2007
through 2010) and increases in revenues to recover capital
expenditures that have separately authorized by the CPUC.
The Utility’s future electric operating revenues will be
impacted by final authorization by the CPUC in the 2011
GRC and by the FERC in the TO rate cases. (See
“Regulatory Matters” below.) The Utility also expects to
continue to collect revenue requirements related to CPUC-
approved capital expenditures outside the GRC, including
capital expenditures for the SmartMeter™advanced
metering project. Revenues will increase to the extent that
the CPUC approves the Utility’s proposals for other capital
projects. Finally, the Utility may earn incentive revenues
under the existing energy efficiency ratemaking
mechanism. (See “Regulatory Matters” below.)
Cost of Electricity
The Utility’s mix of resources used to serve customers is
determined by the availability of the Utility’s own
electricity generation, the amount of electricity supplied
under the DWR’s contracts allocated to the Utility’s
customers, and the cost-effectiveness of other third-party
sources of electricity. The Utility’s cost of electricity
includes costs to purchase power from third parties, certain
transmission costs, the cost of fuel used in its own
generation facilities, and the cost of fuel supplied to other
facilities under tolling agreements. The Utility’s cost of
electricity also includes realized gains and losses on price
risk management activities. (See Notes 10 and 11 of the
Notes to the Consolidated Financial Statements.) The
Utility’s cost of electricity is passed through to customers.
The Utility’s cost of electricity excludes non-fuel costs
associated with operating the Utility’s own generation
facilities, which are included in operating and maintenance
expense in the Consolidated Statements of Income.
The following table provides a summary of the Utility’s
cost of electricity and the total amount and average cost of
purchased power:
(in millions) 2010 2009 2008
Cost of purchased power $ 3,647 $ 3,508 $ 4,261
Fuel used in own generation
facilities 251 203 164
Total cost of electricity $ 3,898 $ 3,711 $ 4,425
Average cost of purchased power
per kWh (1) $ 0.081 $ 0.082 $ 0.089
Total purchased power (in kWh) 44,837 42,767 47,668
(1) Kilowatt-hour
16