PG&E 2010 Annual Report Download - page 13
Download and view the complete annual report
Please find page 13 of the 2010 PG&E annual report below. You can navigate through the pages in the report by either clicking on the pages listed below, or by using the keyword search tool below to find specific information within the annual report.-
 1
1 -
2
-
 3
3 -
 4
4 -
 5
5 -
 6
6 -
 7
7 -
 8
8 -
 9
9 -
 10
10 -
 11
11 -
 12
12 -
 13
13 -
 14
14 -
 15
15 -
 16
16 -
 17
17 -
 18
18 -
 19
19 -
 20
20 -
 21
21 -
 22
22 -
 23
23 -
24
-
25
-
26
-
27
-
28
-
29
-
30
-
31
-
32
-
33
-
34
-
35
-
36
-
37
-
38
-
39
-
40
-
41
-
42
-
43
-
44
-
45
-
46
-
47
-
48
-
49
-
50
-
51
-
52
-
53
-
54
-
55
-
56
-
57
-
58
-
59
-
60
-
61
-
62
-
63
-
64
-
65
-
66
-
67
-
68
-
69
-
70
-
71
-
72
-
73
-
74
-
75
-
76
-
77
-
78
-
79
-
80
-
81
-
82
-
83
-
84
-
85
-
86
-
87
-
88
-
89
-
90
-
91
-
92
-
93
-
94
-
95
-
96
-
97
-
98
-
99
-
100
-
101
-
102
-
103
-
104
-
105
-
106
-
107
-
108
-
109
-
110
-
111
-
112
-
113
-
114
-
115
-
116
-
117
-
118
-
119
-
120
-
121
-
122
-
123
-
124
-
125
-
126
-
127
-
128
 |
 |

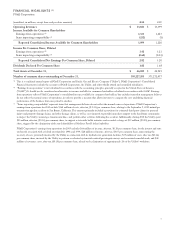
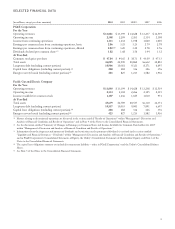
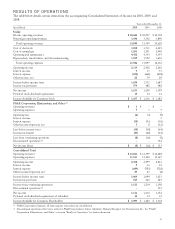
SELECTED FINANCIAL DATA
(in millions, except per share amounts) 2010 2009 2008(1) 2007 2006
PG&E Corporation
For the Year
Operating revenues $ 13,841 $ 13,399 $ 14,628 $ 13,237 $ 12,539
Operating income 2,308 2,299 2,261 2,114 2,108
Income from continuing operations 1,113 1,234 1,198 1,020 1,005
Earnings per common share from continuing operations, basic 2.86 3.25 3.23 2.79 2.78
Earnings per common share from continuing operations, diluted 2.82 (2) 3.20 3.22 2.78 2.76
Dividends declared per common share (3) 1.82 1.68 1.56 1.44 1.32
At Year-End
Common stock price per share $ 47.84 $ 44.65 $ 38.71 $ 43.09 $ 47.33
Total assets 46,025 42,945 40,860 36,632 34,803
Long-term debt (excluding current portion) 10,906 10,381 9,321 8,171 6,697
Capital lease obligations (excluding current portion) (4) 248 282 316 346 376
Energy recovery bonds (excluding current portion) (5) 423 827 1,213 1,582 1,936
Pacific Gas and Electric Company
For the Year
Operating revenues $ 13,840 $ 13,399 $ 14,628 $ 13,238 $ 12,539
Operating income 2,314 2,302 2,266 2,125 2,115
Income available for common stock 1,107 1,236 1,185 1,010 971
At Year-End
Total assets 45,679 42,709 40,537 36,310 34,371
Long-term debt (excluding current portion) 10,557 10,033 9,041 7,891 6,697
Capital lease obligations (excluding current portion) (4) 248 282 316 346 376
Energy recovery bonds (excluding current portion) (5) 423 827 1,213 1,582 1,936
(1) Matters relating to discontinued operations are discussed in the section entitled “Results of Operations” within “Management’s Discussion and
Analysis of Financial Condition and Results of Operations” and in Note 9 of the Notes to the Consolidated Financial Statements.
(2) See the discussion entitled “Summary of Changes in Earnings per Common Share and Income Available for Common Shareholders for 2010”
within “Management’s Discussion and Analysis of Financial Condition and Results of Operations.”
(3) Information about the frequency and amount of dividends and restrictions on the payment of dividends is set forth in the section entitled
“Liquidity and Financial Resources – Dividends” within “Management’s Discussion and Analysis of Financial Condition and Results of Operations,”
and in PG&E Corporation’s Consolidated Statements of Equity, the Utility’s Consolidated Statements of Shareholders’ Equity, and Note 6 of the
Notes to the Consolidated Financial Statements.
(4) The capital lease obligations amounts are included in noncurrent liabilities – other in PG&E Corporation’s and the Utility’s Consolidated Balance
Sheets.
(5) See Note 5 of the Notes to the Consolidated Financial Statements.
9