PG&E 2010 Annual Report Download - page 108
Download and view the complete annual report
Please find page 108 of the 2010 PG&E annual report below. You can navigate through the pages in the report by either clicking on the pages listed below, or by using the keyword search tool below to find specific information within the annual report.-
 1
1 -
2
-
3
-
4
-
5
-
6
-
7
-
8
-
9
-
10
-
11
-
12
-
13
-
14
-
15
-
16
-
17
-
18
-
19
-
20
-
21
-
22
-
23
-
24
-
25
-
26
-
27
-
28
-
29
-
30
-
31
-
32
-
33
-
34
-
35
-
36
-
37
-
38
-
39
-
40
-
41
-
42
-
43
-
44
-
45
-
46
-
47
-
48
-
49
-
50
-
51
-
52
-
53
-
54
-
55
-
56
-
57
-
58
-
59
-
60
-
61
-
62
-
63
-
64
-
65
-
66
-
67
-
68
-
69
-
70
-
71
-
72
-
73
-
74
-
75
-
76
-
77
-
78
-
79
-
80
-
81
-
82
-
83
-
84
-
85
-
86
-
87
-
88
-
89
-
90
-
91
-
92
-
93
-
94
-
95
-
96
-
97
-
 98
98 -
 99
99 -
 100
100 -
 101
101 -
 102
102 -
 103
103 -
 104
104 -
 105
105 -
 106
106 -
 107
107 -
 108
108 -
 109
109 -
 110
110 -
 111
111 -
 112
112 -
 113
113 -
 114
114 -
 115
115 -
 116
116 -
 117
117 -
 118
118 -
119
-
120
-
121
-
122
-
123
-
124
-
125
-
126
-
127
-
128
 |
 |

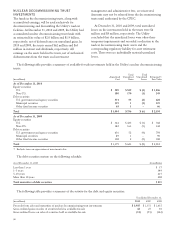
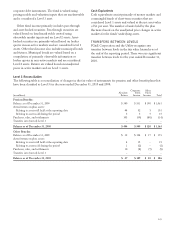
(in millions) Absolute
Return
Corporate
Fixed
Income
Other
Fixed
Income Total
Pension Benefits:
Balance as of December 31, 2008 $ 263 $ 457 $ 291 $ 1,011
Actual return on plan assets:
Relating to assets still held at the reporting date 15 82 14 111
Relating to assets sold during the period 4 4 12 20
Purchases, sales, and settlements 58 (11) (127) (80)
Transfers into (out of) Level 3 – (1) – (1)
Balance as of December 31, 2009 $ 340 $ 531 $ 190 $ 1,061
Other Benefits:
Balance as of December 31, 2008 $ 25 $ 116 $ 25 $ 166
Actual return on plan assets:
Relating to assets still held at the reporting date 2 15 1 18
Relating to assets sold during the period – 1 1 2
Purchases, sales, and settlements 5 (8) (10) (13)
Transfers into (out of) Level 3 – – – –
Balance as of December 31, 2009 $ 32 $ 124 $ 17 $ 173
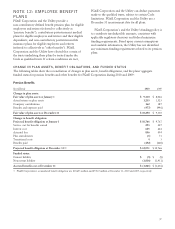
CASH FLOW INFORMATION
EmployerContributions
PG&E Corporation and the Utility contributed $162
million to the pension benefit plans and $94 million to
the other benefit plans in 2010. These contributions are
consistent with PG&E Corporation’s and the Utility’s
funding policy, which is to contribute amounts that are
tax-deductible and consistent with applicable regulatory
decisions and federal minimum funding requirements.
None of these pension or other benefits were subject to a
minimum funding requirement requiring a cash
contribution in 2010. The Utility’s pension benefits met
all the funding requirements under ERISA. PG&E
Corporation and the Utility expect to make total
contributions of approximately $245 million and $58
million to the pension plan and other postretirement
benefit plans, respectively, for 2011.
Benefits Payments
As of December 31, 2010, the estimated benefits expected
to be paid in each of the next five fiscal years, and in
aggregate for the five fiscal years thereafter for PG&E
Corporation, are as follows:
(in millions) Pension Other
2011 $ 509 $ 114
2012 547 117
2013 586 122
2014 624 128
2015 663 133
2016–2020 3,869 725
There were no material differences between the
estimated benefits expected to be paid for PG&E
Corporation and the Utility for the years presented
above.
DEFINED CONTRIBUTION BENEFIT PLANS
PG&E Corporation sponsors employee retirement savings
plans, including a 401(k) defined contribution savings
plan. These plans are qualified under applicable sections
of the Code and provide for tax-deferred salary
deductions, after-tax employee contributions, and
employer contributions. Employer contribution expense
reflected in PG&E Corporation’s Consolidated
Statements of Income was as follows:
(in millions)
Year ended December 31,
2010 $ 56
2009 52
2008 53
There were no material differences between the
employer contribution expense for PG&E Corporation
and the Utility for the years presented above.
104