PG&E 2010 Annual Report Download - page 21
Download and view the complete annual report
Please find page 21 of the 2010 PG&E annual report below. You can navigate through the pages in the report by either clicking on the pages listed below, or by using the keyword search tool below to find specific information within the annual report.-
 1
1 -
2
-
3
-
4
-
5
-
6
-
7
-
8
-
9
-
10
-
 11
11 -
 12
12 -
 13
13 -
 14
14 -
 15
15 -
 16
16 -
 17
17 -
 18
18 -
 19
19 -
 20
20 -
 21
21 -
 22
22 -
 23
23 -
 24
24 -
 25
25 -
 26
26 -
 27
27 -
 28
28 -
 29
29 -
 30
30 -
 31
31 -
32
-
33
-
34
-
35
-
36
-
37
-
38
-
39
-
40
-
41
-
42
-
43
-
44
-
45
-
46
-
47
-
48
-
49
-
50
-
51
-
52
-
53
-
54
-
55
-
56
-
57
-
58
-
59
-
60
-
61
-
62
-
63
-
64
-
65
-
66
-
67
-
68
-
69
-
70
-
71
-
72
-
73
-
74
-
75
-
76
-
77
-
78
-
79
-
80
-
81
-
82
-
83
-
84
-
85
-
86
-
87
-
88
-
89
-
90
-
91
-
92
-
93
-
94
-
95
-
96
-
97
-
98
-
99
-
100
-
101
-
102
-
103
-
104
-
105
-
106
-
107
-
108
-
109
-
110
-
111
-
112
-
113
-
114
-
115
-
116
-
117
-
118
-
119
-
120
-
121
-
122
-
123
-
124
-
125
-
126
-
127
-
128
 |
 |

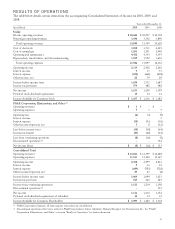
The Utility’s total cost of electricity increased by $187
million, or 5%, in 2010 compared to 2009. This was caused
by an increase in purchased power and an increase in the
cost of fuel used in the Utility’s own generation facilities as
the Utility increased its non-nuclear generation to replace
power that had previously been provided under a DWR
contract that expired at the end of 2009 (costs associated
with power provided to the Utility’s customers under
DWR contracts are not included in the Utility’s cost of
purchased power). The volume of purchased power is
driven by the availability of the Utility’s own electricity
generation and the cost-effectiveness of each source of
electricity.
The Utility’s total cost of electricity decreased by $714
million, or 16%, in 2009 compared to 2008, primarily due
to an 8% decrease in the average price of purchased power
and a 10% decrease in the total volume of purchased
power. The decrease in the average cost of purchased power
was primarily driven by lower market prices for electricity
and gas. The decrease in the volume of purchased power
primarily resulted from an increase in the amount of power
generated by facilities owned by the Utility, such as the
new Gateway Generating Station. The Utility’s mix of
resources is determined by the availability of the Utility’s
own electricity generation and the cost-effectiveness of
each source of electricity.
Various factors will affect the Utility’s future cost of
electricity, including the market prices for electricity and
natural gas, the level of hydroelectric and nuclear power
that the Utility produces, changes in customer demand,
and the amount and timing of power purchases needed to
replace power previously supplied under the DWR
contracts as those contracts expire or are terminated,
replaced, or renegotiated. Additionally, the cost of
electricity is expected to continue reflecting the higher cost
of procuring renewable energy as the Utility increases the
amount of its renewable energy deliveries to comply with
current and future California law and regulatory
requirements. The Utility expects that it will be able to
continue passing through the costs of its renewable energy
purchase commitments to customers. (See “Environmental
Matters – Renewable Energy Resources” and “Risk Factors”
below.)
The Utility’s future cost of electricity also will be
affected by federal or state legislation or rules that may be
adopted to regulate GHG emissions. (See “Environmental
Matters – Climate Change” and “Risk Factors” below.)
Natural Gas Operating Revenues
The Utility sells natural gas and natural gas transportation
services. The Utility’s transportation services are provided
by a transmission system and a distribution system. The
Utility transports gas throughout its service territory by
using its distribution system to deliver to end-use
customers as well as to large end-use customers who are
connected directly to the transmission system. In addition,
the Utility delivers natural gas to off-system markets,
primarily in southern California.
The Utility’s natural gas customers consist of two
categories: residential and smaller commercial customers
known as “core” customers and industrial and larger
commercial customers known as “non-core” customers.
The Utility provides natural gas transportation services to
all core and non-core customers connected to the Utility’s
system in its service territory. Core customers can purchase
natural gas from either the Utility or alternate energy
service providers. The Utility does not procure natural gas
for non-core customers. When the Utility provides both
transportation and natural gas supply, the Utility refers to
the combined service as “bundled natural gas service.” In
2010, core customers represented over 99% of the Utility’s
total customers and 39% of its total natural gas deliveries,
while non-core customers comprised less than 1% of the
Utility’s total customers and 61% of its total natural gas
deliveries.
The following table provides a summary of the Utility’s
natural gas operating revenues:
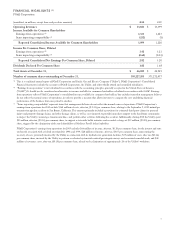
(in millions) 2010 2009 2008
Revenues excluding pass-through
costs $ 1,703 $ 1,667 $ 1,616
Revenues for recovery of passed-
through costs 1,493 1,475 2,274
Total natural gas operating
revenues $ 3,196 $ 3,142 $ 3,890
The Utility’s natural gas operating revenues, including
revenues intended to recover costs that are passed through
to customers, increased by $54 million, or 2%, in 2010
compared to 2009. This reflects an $18 million increase in
the costs that are passed through to customers and do not
impact net income, primarily due to an increase in the cost
of public purpose programs. Natural gas operating
revenues, excluding costs passed through to customers,
increased by $36 million, primarily due to an increase in
authorized base revenue, partially offset by a decrease in
natural gas storage revenues. (The Utility’s storage facilities
were at capacity throughout the year, and less gas was
transported from storage due to the milder weather that
prevailed. As result, the Utility was unable to accept more
gas for storage.)
The Utility’s total natural gas operating revenues,
including revenues intended to recover costs that are
17