PG&E 2010 Annual Report Download - page 94
Download and view the complete annual report
Please find page 94 of the 2010 PG&E annual report below. You can navigate through the pages in the report by either clicking on the pages listed below, or by using the keyword search tool below to find specific information within the annual report.-
 1
1 -
2
-
3
-
4
-
5
-
6
-
7
-
8
-
9
-
10
-
11
-
12
-
13
-
14
-
15
-
16
-
17
-
18
-
19
-
20
-
21
-
22
-
23
-
24
-
25
-
26
-
27
-
28
-
29
-
30
-
31
-
32
-
33
-
34
-
35
-
36
-
37
-
38
-
39
-
40
-
41
-
42
-
43
-
44
-
45
-
46
-
47
-
48
-
49
-
50
-
51
-
52
-
53
-
54
-
55
-
56
-
57
-
58
-
59
-
60
-
61
-
62
-
63
-
64
-
65
-
66
-
67
-
68
-
69
-
70
-
71
-
72
-
73
-
74
-
75
-
76
-
77
-
78
-
79
-
80
-
81
-
82
-
83
-
 84
84 -
 85
85 -
 86
86 -
 87
87 -
 88
88 -
 89
89 -
 90
90 -
 91
91 -
 92
92 -
 93
93 -
 94
94 -
 95
95 -
 96
96 -
 97
97 -
 98
98 -
 99
99 -
 100
100 -
 101
101 -
 102
102 -
 103
103 -
 104
104 -
105
-
106
-
107
-
108
-
109
-
110
-
111
-
112
-
113
-
114
-
115
-
116
-
117
-
118
-
119
-
120
-
121
-
122
-
123
-
124
-
125
-
126
-
127
-
128
 |
 |

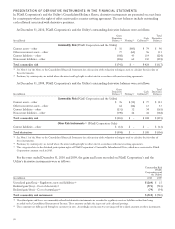
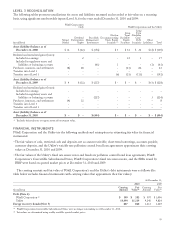
PRESENTATION OF DERIVATIVE INSTRUMENTS IN THE FINANCIAL STATEMENTS
In PG&E Corporation’s and the Utility’s Consolidated Balance Sheets, derivative instruments are presented on a net basis
by counterparty where the right of offset exists under a master netting agreement. The net balances include outstanding
cash collateral associated with derivative positions.
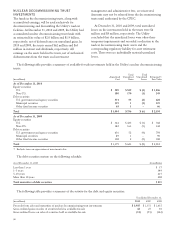
At December 31, 2010, PG&E Corporation’s and the Utility’s outstanding derivative balances were as follows:
(in millions)
Gross
Derivative
Balance (1) Netting (2)
Cash
Collateral (2)
Total
Derivative
Balances
Commodity Risk (PG&E Corporation and the Utility)
Current assets – other $ 56 $(45) $ 79 $ 90
Other noncurrent assets – other 77 (62) 96 111
Current liabilities – other (388) 45 119 (224)
Noncurrent liabilities – other (486) 62 130 (294)
Total commodity risk $ (741) $ – $ 424 $ (317)
(1) See Note 11 of the Notes to the Consolidated Financial Statements for a discussion of the valuation techniques used to calculate the fair value of
these instruments.
(2) Positions, by counterparty, are netted where the intent and legal right to offset exist in accordance with master netting agreements.
At December 31, 2009, PG&E Corporation’s and the Utility’s outstanding derivative balances were as follows:
(in millions)
Gross
Derivative
Balance (1) Netting (2)
Cash
Collateral (2)
Total
Derivative
Balances
Commodity Risk (PG&E Corporation and the Utility)
Current assets – other $ 76 $ (12) $ 77 $ 141
Other noncurrent assets – other 64 (44) 13 33
Current liabilities – other (231) 12 54 (165)
Noncurrent liabilities – other (390) 44 44 (302)
Total commodity risk $ (481) $ – $ 188 $ (293)
OtherRisk Instruments (3) (PG&E Corporation Only)
Current liabilities – other $ (13) $ – $ – $ (13)
Total derivatives $ (494) $ – $ 188 $ (306)
(1) See Note 11 of the Notes to the Consolidated Financial Statements for a discussion of the valuation techniques used to calculate the fair value of
these instruments.
(2) Positions, by counterparty, are netted where the intent and legal right to offset exist in accordance with master netting agreements.
(3) This category relates to the dividend participation rights of PG&E Corporation’s Convertible Subordinated Notes, which were converted to PG&E
Corporation common stock in 2010.
For the years ended December 31, 2010 and 2009, the gains and losses recorded on PG&E Corporation’s and the
Utility’s derivative instruments were as follows:
Commodity Risk
(PG&E
Corporation and
the Utility)
(in millions) 2010 2009
Unrealized gain/(loss) – Regulatory assets and liabilities (1) $ (260) $15
Realized gain/(loss) – Cost of electricity (2) (573) (701)
Realized gain/(loss) – Cost of natural gas (2) (79) (54)
Total commodity risk instruments $ (912) $ (740)
(1) Unrealized gains and losses on commodity risk-related derivative instruments are recorded to regulatory assets or liabilities rather than being
recorded to the Consolidated Statements of Income. These amounts exclude the impact of cash collateral postings.
(2) These amounts are fully passed through to customers in rates. Accordingly, net income was not impacted by realized amounts on these instruments.
90