PG&E 2010 Annual Report Download - page 105
Download and view the complete annual report
Please find page 105 of the 2010 PG&E annual report below. You can navigate through the pages in the report by either clicking on the pages listed below, or by using the keyword search tool below to find specific information within the annual report.-
 1
1 -
2
-
3
-
4
-
5
-
6
-
7
-
8
-
9
-
10
-
11
-
12
-
13
-
14
-
15
-
16
-
17
-
18
-
19
-
20
-
21
-
22
-
23
-
24
-
25
-
26
-
27
-
28
-
29
-
30
-
31
-
32
-
33
-
34
-
35
-
36
-
37
-
38
-
39
-
40
-
41
-
42
-
43
-
44
-
45
-
46
-
47
-
48
-
49
-
50
-
51
-
52
-
53
-
54
-
55
-
56
-
57
-
58
-
59
-
60
-
61
-
62
-
63
-
64
-
65
-
66
-
67
-
68
-
69
-
70
-
71
-
72
-
73
-
74
-
75
-
76
-
77
-
78
-
79
-
80
-
81
-
82
-
83
-
84
-
85
-
86
-
87
-
88
-
89
-
90
-
91
-
92
-
93
-
94
-
 95
95 -
 96
96 -
 97
97 -
 98
98 -
 99
99 -
 100
100 -
 101
101 -
 102
102 -
 103
103 -
 104
104 -
 105
105 -
 106
106 -
 107
107 -
 108
108 -
 109
109 -
 110
110 -
 111
111 -
 112
112 -
 113
113 -
 114
114 -
 115
115 -
116
-
117
-
118
-
119
-
120
-
121
-
122
-
123
-
124
-
125
-
126
-
127
-
128
 |
 |

PG&E Corporation and the Utility apply a risk management framework for managing the risks associated with
employee benefit plan trust assets. The guiding principles of this risk management framework are the clear articulation of
roles and responsibilities, appropriate delegation of authority, and proper accountability and documentation. Trust
investment policies and investment manager guidelines include provisions to ensure prudent diversification, manage risk
through appropriate use of physical direct asset holdings and derivative securities, and identify permitted and prohibited
investments.
The target asset allocation percentages for major categories of trust assets for pension and other benefit plans at
December 31, 2011, 2010, and 2009 are as follows:
Pension Benefits Other Benefits
2011 2010 2009 2011 2010 2009
U.S. Equity 26% 26% 32% 28% 26% 37%
Non-U.S. Equity 14% 14% 18% 15% 13% 18%
Global Equity 5% 5% 5% 3% 3% 3%
Absolute Return 5% 5% 5% 4% 3% 3%
Fixed Income 50% 50% 40% 50% 54% 34%
Cash Equivalents –% –% –% –% 1% 5%
Total 100% 100% 100% 100% 100% 100%
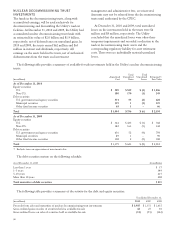
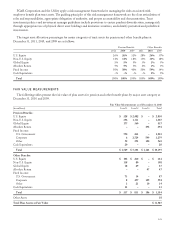
FAIR VALUE MEASUREMENTS
The following tables present the fair value of plan assets for pension and other benefit plans by major asset category at
December 31, 2010 and 2009.
Fair Value Measurements as of December 31, 2010
(in millions) Level 1 Level 2 Level 3 Total
Pension Benefits:
U.S. Equity $ 328 $ 2,482 $ – $ 2,810
Non-U.S. Equity 356 1,111 – 1,467
Global Equity 177 360 – 537
Absolute Return – – 494 494
Fixed Income:
U.S. Government 790 233 – 1,023
Corporate 6 2,724 549 3,279
Other 52 393 120 565
Cash Equivalents 20 – – 20
Total $ 1,729 $ 7,303 $ 1,163 $ 10,195
Other Benefits:
U.S. Equity $ 104 $ 230 $ – $ 334
Non-U.S. Equity 118 80 – 198
Global Equity 18 29 – 47
Absolute Return – – 47 47
Fixed Income:
U.S. Government 73 14 – 87
Corporate 8 457 129 594
Other 32110 34
Cash Equivalents 13 – – 13
Total $ 337 $ 831 $ 186 $ 1,354
Other Assets 38
Total Plan Assets at Fair Value $ 11,587
101