PG&E 2010 Annual Report Download - page 29
Download and view the complete annual report
Please find page 29 of the 2010 PG&E annual report below. You can navigate through the pages in the report by either clicking on the pages listed below, or by using the keyword search tool below to find specific information within the annual report.-
 1
1 -
2
-
3
-
4
-
5
-
6
-
7
-
8
-
9
-
10
-
11
-
12
-
13
-
14
-
15
-
16
-
17
-
18
-
 19
19 -
 20
20 -
 21
21 -
 22
22 -
 23
23 -
 24
24 -
 25
25 -
 26
26 -
 27
27 -
 28
28 -
 29
29 -
 30
30 -
 31
31 -
 32
32 -
 33
33 -
 34
34 -
 35
35 -
 36
36 -
 37
37 -
 38
38 -
 39
39 -
40
-
41
-
42
-
43
-
44
-
45
-
46
-
47
-
48
-
49
-
50
-
51
-
52
-
53
-
54
-
55
-
56
-
57
-
58
-
59
-
60
-
61
-
62
-
63
-
64
-
65
-
66
-
67
-
68
-
69
-
70
-
71
-
72
-
73
-
74
-
75
-
76
-
77
-
78
-
79
-
80
-
81
-
82
-
83
-
84
-
85
-
86
-
87
-
88
-
89
-
90
-
91
-
92
-
93
-
94
-
95
-
96
-
97
-
98
-
99
-
100
-
101
-
102
-
103
-
104
-
105
-
106
-
107
-
108
-
109
-
110
-
111
-
112
-
113
-
114
-
115
-
116
-
117
-
118
-
119
-
120
-
121
-
122
-
123
-
124
-
125
-
126
-
127
-
128
 |
 |

reflects the Utility’s payment to the California Power
Exchange (“PX”) in 2009, partially offset by net tax refunds
that the Utility received in 2009 that were higher than the
amount received in 2010. (The Utility’s payment to the PX
decreased the Utility’s liability for the remaining net
disputed claims that had been made in the Utility’s
Chapter 11 proceeding. See Note 13 of the Notes to the
Consolidated Financial Statements.) The remaining
changes in cash flows from operating activities consisted of
fluctuations in activities within the normal course of
business such as collateral, power purchases, and customer
billings.
During 2009, net cash provided by operating activities
increased $138 million compared to 2008. This increase
reflects significantly lower commodity market prices in
2009 compared to 2008, which resulted in fewer cash
outflows related to the timing of inventory and
procurement activities. These net inflows were partially
offset by the payment to the PX.
On December 17, 2010, the Tax Relief Act was signed
into law, allowing qualified property placed into service
after September 8, 2010, and before January 1, 2012, to be
eligible for 100% bonus depreciation for tax purposes and
qualified property placed into service in 2012 to be eligible
for 50% bonus depreciation for tax purposes. (See Note 9
of the Notes to the Consolidated Financial Statements.) As
a result, the Utility expects to make no federal tax payment
in 2011. A reduction in the 2012 federal tax payment is
expected; however, the amount cannot be reasonably
estimated at this time. (See “Regulatory Matters – CPUC
Resolution Regarding the Tax Relief Act” below.)
Additionally, there is uncertainty around the timing and
amount of payments to be made to third parties in
connection with the San Bruno accident, the timing and
amount of related insurance recoveries, any penalties that
may be assessed, costs associated with related
investigations, and costs associated with changes to
pipeline management and operations.
Investing Activities
The Utility’s investing activities consist of construction of
new and replacement facilities necessary to deliver safe and
reliable electricity and natural gas services to its customers.
Cash used in investing activities depends primarily upon
the amount and timing of the Utility’s capital expenditures,
which can be affected by many factors, including the
timing of regulatory approvals and the occurrence of
storms and other events causing outages or damages to the
Utility’s infrastructure. Cash used in investing activities
also includes the proceeds from sales of nuclear
decommissioning trust investments, largely offset by the
amount of cash used to purchase new nuclear
decommissioning trust investments. (See Note 11 of the
Notes to the Consolidated Financial Statements.)
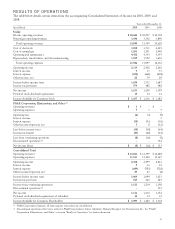
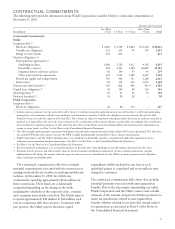
The Utility’s cash flows from investing activities for
2010, 2009, and 2008 were as follows:
(in millions) 2010 2009 2008
Capital expenditures $ (3,802) $ (3,958) $ (3,628)
Decrease in restricted cash 66 666 36
Proceeds from sales and
maturities of nuclear
decommissioning trust
investments 1,405 1,351 1,635
Purchases of nuclear
decommissioning trust
investments (1,456) (1,414) (1,684)
Other 19 11 1
Net cash used in investing
activities $ (3,768) $ (3,344) $ (3,640)
Net cash used in investing activities increased by $424
million in 2010 compared to 2009, primarily due to the
Utility’s $700 million payment to the PX, which decreased
the restricted cash balance in 2009. (See Note 13 of the
Notes to the Consolidated Financial Statements.) This
increase was partially offset by a decrease in capital
expenditures of $156 million as compared to 2009. Capital
expenditures decreased in 2010 due to permitting delays,
the postponement of purchases of materials that would
otherwise have been capitalized earlier in the year, and
poor weather conditions in the first half of 2010, which
delayed construction activities as resources were re-directed
to emergency response activities.
Net cash used in investing decreased by $296 million in
2009 compared to 2008, primarily due to a $700 million
decrease in the restricted cash balance that resulted from
the Utility’s payment to the PX, partially offset by an
increase of $330 million in capital expenditures. The
increase in capital expenditures in 2009 compared to 2008
was due to the increase in installation of the SmartMeter™
advanced metering infrastructure, generation facility
spending, replacing and expanding gas and electric
distribution systems, and improving the electric
transmission infrastructure. (See “Capital Expenditures”
below.)
Future cash flows used in investing activities are largely
dependent on the timing and amount of capital
expenditures. (See “Capital Expenditures” below for further
discussion of expected spending and significant capital
projects.)
25