PG&E 2010 Annual Report Download - page 22
Download and view the complete annual report
Please find page 22 of the 2010 PG&E annual report below. You can navigate through the pages in the report by either clicking on the pages listed below, or by using the keyword search tool below to find specific information within the annual report.-
 1
1 -
2
-
3
-
4
-
5
-
6
-
7
-
8
-
9
-
10
-
11
-
 12
12 -
 13
13 -
 14
14 -
 15
15 -
 16
16 -
 17
17 -
 18
18 -
 19
19 -
 20
20 -
 21
21 -
 22
22 -
 23
23 -
 24
24 -
 25
25 -
 26
26 -
 27
27 -
 28
28 -
 29
29 -
 30
30 -
 31
31 -
 32
32 -
33
-
34
-
35
-
36
-
37
-
38
-
39
-
40
-
41
-
42
-
43
-
44
-
45
-
46
-
47
-
48
-
49
-
50
-
51
-
52
-
53
-
54
-
55
-
56
-
57
-
58
-
59
-
60
-
61
-
62
-
63
-
64
-
65
-
66
-
67
-
68
-
69
-
70
-
71
-
72
-
73
-
74
-
75
-
76
-
77
-
78
-
79
-
80
-
81
-
82
-
83
-
84
-
85
-
86
-
87
-
88
-
89
-
90
-
91
-
92
-
93
-
94
-
95
-
96
-
97
-
98
-
99
-
100
-
101
-
102
-
103
-
104
-
105
-
106
-
107
-
108
-
109
-
110
-
111
-
112
-
113
-
114
-
115
-
116
-
117
-
118
-
119
-
120
-
121
-
122
-
123
-
124
-
125
-
126
-
127
-
128
 |
 |

passed through to customers, decreased by $748 million, or
19%, in 2009 compared to 2008. This reflects a $799
million decrease in the total cost of natural gas that is
passed through to customers and generally does not impact
net income. (See “Cost of Natural Gas” below.) Natural gas
operating revenues, excluding costs passed through to
customers, increased by $51 million, primarily due to an
increase in authorized base revenues.
The Utility’s future natural gas operating revenues will
be impacted by final authorization by the CPUC in the
2011 GRC and the 2011 Gas Transmission and Storage rate
case. Finally, the Utility may earn incentive revenues under
the existing energy efficiency ratemaking mechanism. (See
“Regulatory Matters” below.)
Cost of Natural Gas
The Utility’s cost of natural gas includes the purchase costs
of natural gas, transportation costs on interstate pipelines,
and gas storage costs but excludes the transportation costs
on intrastate pipelines for core and non-core customers,
which are included in operating and maintenance expense
in the Consolidated Statements of Income. The Utility’s
cost of natural gas also includes realized gains and losses on
price risk management activities. (See Notes 10 and 11 of
the Notes to the Consolidated Financial Statements.)
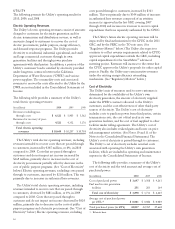
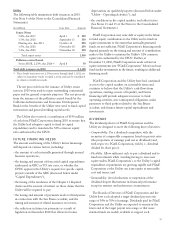
The following table provides a summary of the Utility’s
cost of natural gas:
(in millions) 2010 2009 2008
Cost of natural gas sold $ 1,119 $ 1,130 $ 1,955
Transportation cost of natural gas
sold 172 161 135
Total cost of natural gas $ 1,291 $ 1,291 $ 2,090
Average cost per Mcf (1) of natural
gas sold $ 4.69 $ 4.47 $ 7.43
Total natural gas sold (in millions
of Mcf) 249 253 263
(1) One thousand cubic feet
The Utility’s total cost of natural gas decreased by less
than $1 million in 2010 compared to 2009. The Utility
received $49 million in the first quarter of 2010 to be
refunded to customers as part of a litigation settlement
arising from the manipulation of the natural gas market by
third parties during 1999 through 2002. The decrease
resulting from the settlement was partially offset by an
increase in transportation costs primarily due to attrition
adjustments and an increase in procurement costs due to
increases in the average market price of natural gas
purchased.
The Utility’s total cost of natural gas decreased by $799
million, or 38%, in 2009 compared to 2008, primarily due
to decreases in the average market price of natural gas.
The Utility’s future cost of natural gas will be affected
by the market price of natural gas and changes in customer
demand. In addition, the Utility’s future cost of natural gas
may be affected by federal or state legislation or rules to
regulate the GHG emissions from the Utility’s natural gas
transportation and distribution facilities and from natural
gas consumed by the Utility’s customers.
Operatingand Maintenance
Operating and maintenance expenses consist mainly of the
Utility’s costs to operate and maintain its electricity and
natural gas facilities, customer billing and service expenses,
the cost of public purpose programs, and administrative
and general expenses. Operating and maintenance expenses
are influenced by wage inflation; changes in liabilities for
employee benefits; property taxes; the timing and length of
Diablo Canyon refueling outages; the occurrence of
storms, wildfires, and other events causing outages and
damages in the Utility’s service territory; environmental
remediation costs; legal costs; changes in the accrual for
legal matters; materials costs; the level of uncollectible
customer accounts; and various other factors. Although
some of the Utility’s operating and maintenance expenses,
like the cost of public purpose programs, are passed
through to customers and generally do not impact net
income, many other expenses are less predictable and less
controllable and do impact net income. The Utility’s
ability to earn its authorized rate of return depends in large
part on the success of its ability to manage these expenses
and to achieve operational and cost efficiencies.
The Utility’s operating and maintenance expenses
(including costs passed through to customers) increased by
$89 million, or 2%, in 2010 compared to 2009. During
2010, the change in pass-through operating and
maintenance costs as compared to 2009 was immaterial.
The increase in operating and maintenance expenses was
primarily due to $283 million of costs associated with the
San Bruno accident. This amount includes a provision of
$220 million for estimated third-party claims, including
personal injury and property damage claims, damage to
infrastructure, and other damage claims. (See Note 15 of
the Notes to the Consolidated Financial Statements.) The
additional $63 million of costs associated with the San
Bruno accident were incurred to provide immediate
support to the San Bruno community, re-inspect the
Utility’s natural gas transmission lines, and perform other
activities following the accident. Additionally, operating
and maintenance expenses increased due to a $36 million
provision that was recorded for SmartMeter™related
18