PG&E 2010 Annual Report Download - page 84
Download and view the complete annual report
Please find page 84 of the 2010 PG&E annual report below. You can navigate through the pages in the report by either clicking on the pages listed below, or by using the keyword search tool below to find specific information within the annual report.-
 1
1 -
2
-
3
-
4
-
5
-
6
-
7
-
8
-
9
-
10
-
11
-
12
-
13
-
14
-
15
-
16
-
17
-
18
-
19
-
20
-
21
-
22
-
23
-
24
-
25
-
26
-
27
-
28
-
29
-
30
-
31
-
32
-
33
-
34
-
35
-
36
-
37
-
38
-
39
-
40
-
41
-
42
-
43
-
44
-
45
-
46
-
47
-
48
-
49
-
50
-
51
-
52
-
53
-
54
-
55
-
56
-
57
-
58
-
59
-
60
-
61
-
62
-
63
-
64
-
65
-
66
-
67
-
68
-
69
-
70
-
71
-
72
-
73
-
 74
74 -
 75
75 -
 76
76 -
 77
77 -
 78
78 -
 79
79 -
 80
80 -
 81
81 -
 82
82 -
 83
83 -
 84
84 -
 85
85 -
 86
86 -
 87
87 -
 88
88 -
 89
89 -
 90
90 -
 91
91 -
 92
92 -
 93
93 -
 94
94 -
95
-
96
-
97
-
98
-
99
-
100
-
101
-
102
-
103
-
104
-
105
-
106
-
107
-
108
-
109
-
110
-
111
-
112
-
113
-
114
-
115
-
116
-
117
-
118
-
119
-
120
-
121
-
122
-
123
-
124
-
125
-
126
-
127
-
128
 |
 |

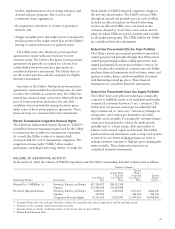
Stock Options
The exercise price of stock options granted under the
2006 LTIP and all other outstanding stock options is
equal to the market price of PG&E Corporation’s
common stock on the date of grant. Stock options
generally have a 10-year term and vest over four years of
continuous service, subject to accelerated vesting in
certain circumstances.
The following table summarizes total intrinsic value
(fair market value of PG&E Corporation’s common stock
less exercise price) of options exercised:
PG&E Corporation
(in millions) 2010 2009 2008
Intrinsic value of options exercised $ 15 $ 18 $ 13
The tax benefit from stock options exercised totaled
$0.5 million, $6 million, and $4 million for 2010, 2009,
and 2008 respectively.
The following table summarizes stock option activity for 2010:
Options Shares Weighted Average
Exercise Price
Weighted
Average
Remaining
Contractual
Term Aggregate
Intrinsic Value
Outstanding at January 1 1,975,341 $ 23.99
Granted 1,742 42.97
Exercised (605,585) 22.67
Forfeited or expired (1,587) 30.13
Outstanding at December 31 1,369,911 25.16 2.76 $ 31,068,628
Expected to vest at December 31 21,401 37.77 7.89 $ 215,584
Exercisable at December 31 1,348,510 $ 24.96 2.68 $ 30,853,045
As of December 31, 2010, there was less than $1
million of total unrecognized compensation cost related
to outstanding stock options.
Restricted Stock
During 2010, PG&E Corporation awarded 10,540 shares
of restricted common stock to eligible participants under
the 2006 LTIP. The terms of the restricted stock award
agreements provide that the shares will vest over a five-
year period. Although the recipients of restricted stock
possess voting rights, they may not sell or transfer their
shares until the shares vest.
Prior to 2010, PG&E Corporation also awarded
restricted stock to eligible employees under the 2006
LTIP. The terms of these restricted stock award
agreements provide that 60% of the shares will vest over a
period of three years at the rate of 20% per year. If PG&E
Corporation’s annual total shareholder return (“TSR”) is
in the top quartile of its comparator group, as measured
for the three immediately preceding calendar years, the
restrictions on the remaining 40% of the shares will lapse
in the third year. If PG&E Corporation’s TSR is not in
the top quartile for that period, then the restrictions on
the remaining 40% of the shares will lapse in the fifth
year. Compensation expense related to the portion of the
restricted stock award that is subject to conditions based
on TSR is recognized over the shorter of the requisite
service period and three years. Dividends declared on
restricted stock are paid to recipients only when the
restricted stock vests.
The weighted average grant-date fair value per-share of
restricted stock granted during 2010, 2009, and 2008 was
$42.97, $35.53, and $37.91, respectively. The total fair
value of restricted stock that vested during 2010, 2009,
and 2008 was $8 million, $24 million, and $19 million,
respectively. The tax benefit from restricted stock that
vested during 2010, 2009, and 2008 was not material.
The following table summarizes restricted stock
activity for 2010:
Number of
Shares of
Restricted
Stock
Weighted
Average
Grant-Date
Fair Value
Nonvested at January 1 670,552 $ 41.11
Granted 10,540 $ 42.97
Vested (189,976) $ 41.70
Forfeited (15,236) $ 42.52
Nonvested at December 31 475,880 $ 40.87
80