PG&E 2010 Annual Report Download - page 59
Download and view the complete annual report
Please find page 59 of the 2010 PG&E annual report below. You can navigate through the pages in the report by either clicking on the pages listed below, or by using the keyword search tool below to find specific information within the annual report.-
 1
1 -
2
-
3
-
4
-
5
-
6
-
7
-
8
-
9
-
10
-
11
-
12
-
13
-
14
-
15
-
16
-
17
-
18
-
19
-
20
-
21
-
22
-
23
-
24
-
25
-
26
-
27
-
28
-
29
-
30
-
31
-
32
-
33
-
34
-
35
-
36
-
37
-
38
-
39
-
40
-
41
-
42
-
43
-
44
-
45
-
46
-
47
-
48
-
 49
49 -
 50
50 -
 51
51 -
 52
52 -
 53
53 -
 54
54 -
 55
55 -
 56
56 -
 57
57 -
 58
58 -
 59
59 -
 60
60 -
 61
61 -
 62
62 -
 63
63 -
 64
64 -
 65
65 -
 66
66 -
 67
67 -
 68
68 -
 69
69 -
70
-
71
-
72
-
73
-
74
-
75
-
76
-
77
-
78
-
79
-
80
-
81
-
82
-
83
-
84
-
85
-
86
-
87
-
88
-
89
-
90
-
91
-
92
-
93
-
94
-
95
-
96
-
97
-
98
-
99
-
100
-
101
-
102
-
103
-
104
-
105
-
106
-
107
-
108
-
109
-
110
-
111
-
112
-
113
-
114
-
115
-
116
-
117
-
118
-
119
-
120
-
121
-
122
-
123
-
124
-
125
-
126
-
127
-
128
 |
 |

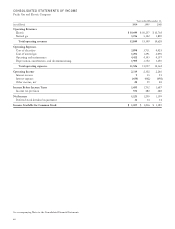
CONSOLIDATED STATEMENTS OF INCOME
PG&E Corporation
Year ended December 31,
(in millions, except per share amounts) 2010 2009 2008
Operating Revenues
Electric $ 10,645 $ 10,257 $ 10,738
Natural gas 3,196 3,142 3,890
Total operating revenues 13,841 13,399 14,628
Operating Expenses
Cost of electricity 3,898 3,711 4,425
Cost of natural gas 1,291 1,291 2,090
Operating and maintenance 4,439 4,346 4,201
Depreciation, amortization, and decommissioning 1,905 1,752 1,651
Total operating expenses 11,533 11,100 12,367
Operating Income 2,308 2,299 2,261
Interest income 933 94
Interest expense (684) (705) (728)
Other income (expense), net 27 67 (4)
Income Before Income Taxes 1,660 1,694 1,623
Income tax provision 547 460 425
Income from Continuing Operations 1,113 1,234 1,198
Discontinued Operations
NEGT income tax benefit –– 154
Net Income 1,113 1,234 1,352
Preferred stock dividend requirement of subsidiary 14 14 14
Income Available for Common Shareholders $ 1,099 $ 1,220 $ 1,338
Weighted Average Common Shares Outstanding, Basic 382 368 357
Weighted Average Common Shares Outstanding, Diluted 392 386 358
Earnings Per Common Share from Continuing Operations, Basic $ 2.86 $ 3.25 $ 3.23
Net Earnings Per Common Share, Basic $ 2.86 $ 3.25 $ 3.64
Earnings Per Common Share from Continuing Operations, Diluted $ 2.82 $ 3.20 $ 3.22
Net Earnings Per Common Share, Diluted $ 2.82 $ 3.20 $ 3.63
Dividends Declared Per Common Share $ 1.82 $ 1.68 $ 1.56
See accompanying Notes to the Consolidated Financial Statements.
55