PG&E 2010 Annual Report Download - page 19
Download and view the complete annual report
Please find page 19 of the 2010 PG&E annual report below. You can navigate through the pages in the report by either clicking on the pages listed below, or by using the keyword search tool below to find specific information within the annual report.-
 1
1 -
2
-
3
-
4
-
5
-
6
-
7
-
8
-
 9
9 -
 10
10 -
 11
11 -
 12
12 -
 13
13 -
 14
14 -
 15
15 -
 16
16 -
 17
17 -
 18
18 -
 19
19 -
 20
20 -
 21
21 -
 22
22 -
 23
23 -
 24
24 -
 25
25 -
 26
26 -
 27
27 -
 28
28 -
 29
29 -
30
-
31
-
32
-
33
-
34
-
35
-
36
-
37
-
38
-
39
-
40
-
41
-
42
-
43
-
44
-
45
-
46
-
47
-
48
-
49
-
50
-
51
-
52
-
53
-
54
-
55
-
56
-
57
-
58
-
59
-
60
-
61
-
62
-
63
-
64
-
65
-
66
-
67
-
68
-
69
-
70
-
71
-
72
-
73
-
74
-
75
-
76
-
77
-
78
-
79
-
80
-
81
-
82
-
83
-
84
-
85
-
86
-
87
-
88
-
89
-
90
-
91
-
92
-
93
-
94
-
95
-
96
-
97
-
98
-
99
-
100
-
101
-
102
-
103
-
104
-
105
-
106
-
107
-
108
-
109
-
110
-
111
-
112
-
113
-
114
-
115
-
116
-
117
-
118
-
119
-
120
-
121
-
122
-
123
-
124
-
125
-
126
-
127
-
128
 |
 |

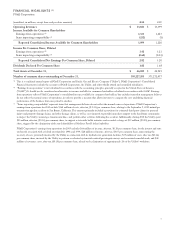
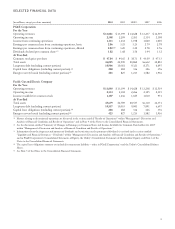
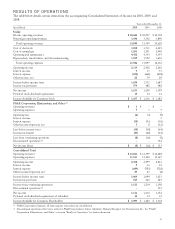
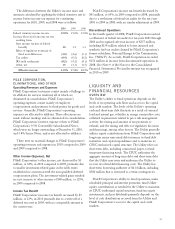
RESULTS OF OPERATIONS
The table below details certain items from the accompanying Consolidated Statements of Income for 2010, 2009, and
2008:
Year ended December 31,
(in millions) 2010 2009 2008
Utility
Electric operating revenues $ 10,644 $ 10,257 $ 10,738
Natural gas operating revenues 3,196 3,142 3,890
Total operating revenues 13,840 13,399 14,628
Cost of electricity 3,898 3,711 4,425
Cost of natural gas 1,291 1,291 2,090
Operating and maintenance 4,432 4,343 4,197
Depreciation, amortization, and decommissioning 1,905 1,752 1,650
Total operating expenses 11,526 11,097 12,362
Operating income 2,314 2,302 2,266
Interest income 933 91
Interest expense (650) (662) (698)
Other income, net 22 59 28
Income before income taxes 1,695 1,732 1,687
Income tax provision 574 482 488
Net income 1,121 1,250 1,199
Preferred stock dividend requirement 14 14 14
Income Available for Common Stock $ 1,107 $ 1,236 $ 1,185
PG&E Corporation, Eliminations, and Other (1)
Operating revenues $1$–$–
Operating expenses 735
Operating loss (6) (3) (5)
Interest income ––3
Interest expense (34) (43) (30)
Other income (expense), net 58 (32)
Loss before income taxes (35) (38) (64)
Income tax benefit (27) (22) (63)
Loss from continuing operations (8) (16) (1)
Discontinued operations (2) –– 154
Net income (loss) $ (8) $ (16) $ 153
Consolidated Total
Operating revenues $ 13,841 $ 13,399 $ 14,628
Operating expenses 11,533 11,100 12,367
Operating income 2,308 2,299 2,261
Interest income 933 94
Interest expense (684) (705) (728)
Other income (expense), net 27 67 (4)
Income before income taxes 1,660 1,694 1,623
Income tax provision 547 460 425
Income from continuing operations 1,113 1,234 1,198
Discontinued operations (2) –– 154
Net income 1,113 1,234 1,352
Preferred stock dividend requirement of subsidiary 14 14 14
Income Available for Common Shareholders $ 1,099 $ 1,220 $ 1,338
(1) PG&E Corporation eliminates all intercompany transactions in consolidation.
(2) Discontinued operations reflect items related to PG&E Corporation’s former subsidiary, National Energy & Gas Transmission, Inc. See “PG&E
Corporation, Eliminations, and Other” section in “Results of Operations” for further discussion.
15