PG&E 2010 Annual Report Download - page 102
Download and view the complete annual report
Please find page 102 of the 2010 PG&E annual report below. You can navigate through the pages in the report by either clicking on the pages listed below, or by using the keyword search tool below to find specific information within the annual report.-
 1
1 -
2
-
3
-
4
-
5
-
6
-
7
-
8
-
9
-
10
-
11
-
12
-
13
-
14
-
15
-
16
-
17
-
18
-
19
-
20
-
21
-
22
-
23
-
24
-
25
-
26
-
27
-
28
-
29
-
30
-
31
-
32
-
33
-
34
-
35
-
36
-
37
-
38
-
39
-
40
-
41
-
42
-
43
-
44
-
45
-
46
-
47
-
48
-
49
-
50
-
51
-
52
-
53
-
54
-
55
-
56
-
57
-
58
-
59
-
60
-
61
-
62
-
63
-
64
-
65
-
66
-
67
-
68
-
69
-
70
-
71
-
72
-
73
-
74
-
75
-
76
-
77
-
78
-
79
-
80
-
81
-
82
-
83
-
84
-
85
-
86
-
87
-
88
-
89
-
90
-
91
-
 92
92 -
 93
93 -
 94
94 -
 95
95 -
 96
96 -
 97
97 -
 98
98 -
 99
99 -
 100
100 -
 101
101 -
 102
102 -
 103
103 -
 104
104 -
 105
105 -
 106
106 -
 107
107 -
 108
108 -
 109
109 -
 110
110 -
 111
111 -
 112
112 -
113
-
114
-
115
-
116
-
117
-
118
-
119
-
120
-
121
-
122
-
123
-
124
-
125
-
126
-
127
-
128
 |
 |

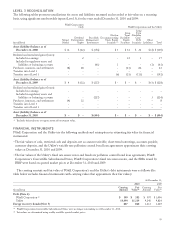
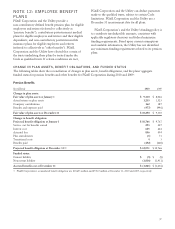
OtherBenefits
(in millions) 2010 2009
Change in plan assets:
Fair value of plan assets at January 1 $ 1,169 $ 990
Actual return on plan assets 147 166
Company contributions 94 87
Plan participant contribution 49 42
Benefits and expenses paid (122) (116)
Fair value of plan assets at December 31 $ 1,337 $ 1,169
Change in benefit obligation:
Benefit obligation at January 1 $ 1,511 $ 1,382
Service cost for benefits earned 36 30
Interest cost 88 87
Actuarial loss 52 72
Plan amendments 128 –
Transitional costs 11
Benefits paid (113) (106)
Federal subsidy on benefits paid 34
Plan participant contributions 49 41
Benefit obligation at December 31 $ 1,755 $ 1,511
Funded status:
Noncurrent liability $ (418) $ (342)
Accrued benefit cost at December 31 $ (418) $ (342)
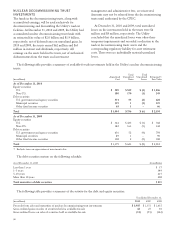
There was no material difference between PG&E Corporation and the Utility for the information disclosed above.
On February 16, 2010, the Utility amended its contributory postretirement medical plans for retirees to provide for
additional employer contributions toward retiree premiums. The plan amendment was accounted for as a plan
modification that required re-measurement of the accumulated benefit obligation, plan assets, and periodic benefit costs.
The inputs and assumptions used in re-measurement did not change significantly from December 31, 2009 and did not
have a material impact on the funded status of the plans. The re-measurement of the accumulated benefit obligation and
plan assets resulted in an increase to other postretirement benefits and a decrease to other comprehensive income of $148
million. The impact to net periodic benefit cost was not material.
Components of Net Periodic Benefit Cost
Net periodic benefit cost as reflected in PG&E Corporation’s Consolidated Statements of Income for 2010, 2009, and
2008 is as follows:
PensionBenefits
December 31,
(in millions) 2010 2009 2008
Service cost for benefits earned $ 279 $ 259 $ 236
Interest cost 645 624 581
Expected return on plan assets (624) (579) (696)
Amortization of prior service cost 53 53 47
Amortization of unrecognized loss 44 101 1
Net periodic benefit cost 397 458 169
Less: transfer to regulatory account (1) (233) (294) (4)
Total $ 164 $ 164 $ 165
(1) The Utility recorded $233 million, $295 million, and $4 million for the years ended December 31, 2010, 2009, and 2008, respectively, to a
regulatory account as the amounts are probable of recovery from customers in future rates.
98