Hertz 2014 Annual Report Download - page 98
Download and view the complete annual report
Please find page 98 of the 2014 Hertz annual report below. You can navigate through the pages in the report by either clicking on the pages listed below, or by using the keyword search tool below to find specific information within the annual report.-
 1
1 -
2
-
3
-
4
-
5
-
6
-
7
-
8
-
9
-
10
-
11
-
12
-
13
-
14
-
15
-
16
-
17
-
18
-
19
-
20
-
21
-
22
-
23
-
24
-
25
-
26
-
27
-
28
-
29
-
30
-
31
-
32
-
33
-
34
-
35
-
36
-
37
-
38
-
39
-
40
-
41
-
42
-
43
-
44
-
45
-
46
-
47
-
48
-
49
-
50
-
51
-
52
-
53
-
54
-
55
-
56
-
57
-
58
-
59
-
60
-
61
-
62
-
63
-
64
-
65
-
66
-
67
-
68
-
69
-
70
-
71
-
72
-
73
-
74
-
75
-
76
-
77
-
78
-
79
-
80
-
81
-
82
-
83
-
84
-
85
-
86
-
87
-
 88
88 -
 89
89 -
 90
90 -
 91
91 -
 92
92 -
 93
93 -
 94
94 -
 95
95 -
 96
96 -
 97
97 -
 98
98 -
 99
99 -
 100
100 -
 101
101 -
 102
102 -
 103
103 -
 104
104 -
 105
105 -
 106
106 -
 107
107 -
 108
108 -
109
-
110
-
111
-
112
-
113
-
114
-
115
-
116
-
117
-
118
-
119
-
120
-
121
-
122
-
123
-
124
-
125
-
126
-
127
-
128
-
129
-
130
-
131
-
132
-
133
-
134
-
135
-
136
-
137
-
138
-
139
-
140
-
141
-
142
-
143
-
144
-
145
-
146
-
147
-
148
-
149
-
150
-
151
-
152
-
153
-
154
-
155
-
156
-
157
-
158
-
159
-
160
-
161
-
162
-
163
-
164
-
165
-
166
-
167
-
168
-
169
-
170
-
171
-
172
-
173
-
174
-
175
-
176
-
177
-
178
-
179
-
180
-
181
-
182
-
183
-
184
-
185
-
186
-
187
-
188
-
189
-
190
-
191
-
192
-
193
-
194
-
195
-
196
-
197
-
198
-
199
-
200
-
201
-
202
-
203
-
204
-
205
-
206
-
207
-
208
-
209
-
210
-
211
-
212
-
213
-
214
-
215
-
216
-
217
-
218
-
219
-
220
-
221
-
222
-
223
-
224
-
225
-
226
-
227
-
228
-
229
-
230
-
231
-
232
-
233
-
234
-
235
-
236
-
237
-
238
-
239
-
240
-
241
-
242
-
243
-
244
-
245
-
246
-
247
-
248
-
249
-
250
-
251
-
252
-
253
-
254
-
255
-
256
-
257
-
258
-
259
-
260
-
261
-
262
-
263
-
264
-
265
-
266
-
267
-
268
-
269
-
270
-
271
-
272
-
273
-
274
-
275
-
276
-
277
-
278
-
279
-
280
-
281
-
282
-
283
-
284
-
285
-
286
-
287
-
288
-
289
-
290
-
291
-
292
-
293
-
294
-
295
-
296
-
297
-
298
-
299
-
300
-
301
-
302
-
303
-
304
-
305
-
306
-
307
-
308
-
309
-
310
-
311
-
312
-
313
-
314
-
315
-
316
-
317
-
318
-
319
-
320
-
321
-
322
-
323
-
324
-
325
-
326
-
327
-
328
-
329
-
330
-
331
-
332
-
333
-
334
-
335
-
336
-
337
-
338
-
339
-
340
-
341
-
342
-
343
-
344
-
345
-
346
-
347
-
348
-
349
-
350
-
351
-
352
-
353
-
354
-
355
-
356
-
357
-
358
-
359
-
360
-
361
-
362
-
363
-
364
-
365
-
366
-
367
-
368
-
369
-
370
-
371
-
372
-
373
-
374
-
375
-
376
-
377
-
378
-
379
-
380
-
381
-
382
-
383
-
384
-
385
-
386
 |
 |

Table of Contents
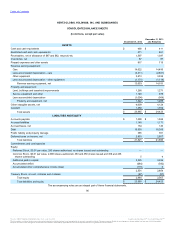
Cash and cash equivalents $ 490
$ 411
Restricted cash and cash equivalents 571
861
Receivables, net of allowance of $67 and $62, respectively 1,597
1,397
Inventories, net 67
87
Prepaid expenses and other assets 917
715
Revenue earning equipment:
Cars 14,622
14,456
Less accumulated depreciation - cars (3,411)
(2,681)
Other equipment 3,613
3,535
Less accumulated depreciation - other equipment (1,171)
(1,119)
Revenue earning equipment, net 13,653
14,191
Property and equipment:
Land, buildings and leasehold improvements 1,268
1,271
Service equipment and other 1,148
978
Less accumulated depreciation (1,094)
(964)
Property and equipment, net 1,322
1,285
Other intangible assets, net 4,009
4,124
Goodwill 1,359
1,352
Total assets $ 23,985
$ 24,423
Accounts payable $ 1,008
$ 1,022
Accrued liabilities 1,148
1,171
Accrued taxes, net 134
146
Debt 15,993
16,309
Public liability and property damage 385
351
Deferred taxes on income, net 2,853
2,857
Total liabilities 21,521
21,856
Commitments and contingencies
Equity:
Preferred Stock, $0.01 par value, 200 shares authorized, no shares issued and outstanding —
—
Common Stock, $0.01 par value, 2,000 shares authorized, 463 and 450 shares issued and 459 and 446
shares outstanding 5 4
Additional paid-in capital 3,325 3,226
Accumulated deficit (664) (582)
Accumulated other comprehensive income (loss) (115) 6
2,551 2,654
Treasury Stock, at cost, 4 shares and 4 shares (87) (87)
Total equity 2,464 2,567
Total liabilities and equity $ 23,985
$ 24,423
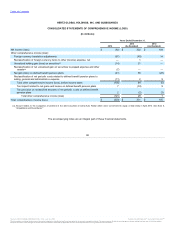
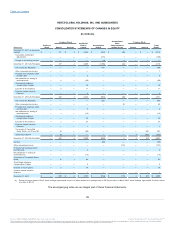
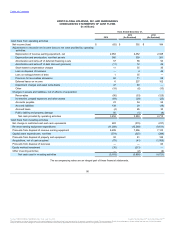
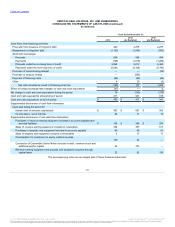
The accompanying notes are an integral part of these financial statements.
86
Source: HERTZ GLOBAL HOLDINGS INC, 10-K, July 16, 2015 Powered by Morningstar® Document Research℠
The information contained herein may not be copied, adapted or distributed and is not warranted to be accurate, complete or timely. The user assumes all risks for any damages or losses arising from any use of this information,
except to the extent such damages or losses cannot be limited or excluded by applicable law. Past financial performance is no guarantee of future results.