Hertz 2014 Annual Report Download - page 85
Download and view the complete annual report
Please find page 85 of the 2014 Hertz annual report below. You can navigate through the pages in the report by either clicking on the pages listed below, or by using the keyword search tool below to find specific information within the annual report.-
 1
1 -
2
-
3
-
4
-
5
-
6
-
7
-
8
-
9
-
10
-
11
-
12
-
13
-
14
-
15
-
16
-
17
-
18
-
19
-
20
-
21
-
22
-
23
-
24
-
25
-
26
-
27
-
28
-
29
-
30
-
31
-
32
-
33
-
34
-
35
-
36
-
37
-
38
-
39
-
40
-
41
-
42
-
43
-
44
-
45
-
46
-
47
-
48
-
49
-
50
-
51
-
52
-
53
-
54
-
55
-
56
-
57
-
58
-
59
-
60
-
61
-
62
-
63
-
64
-
65
-
66
-
67
-
68
-
69
-
70
-
71
-
72
-
73
-
74
-
 75
75 -
 76
76 -
 77
77 -
 78
78 -
 79
79 -
 80
80 -
 81
81 -
 82
82 -
 83
83 -
 84
84 -
 85
85 -
 86
86 -
 87
87 -
 88
88 -
 89
89 -
 90
90 -
 91
91 -
 92
92 -
 93
93 -
 94
94 -
 95
95 -
96
-
97
-
98
-
99
-
100
-
101
-
102
-
103
-
104
-
105
-
106
-
107
-
108
-
109
-
110
-
111
-
112
-
113
-
114
-
115
-
116
-
117
-
118
-
119
-
120
-
121
-
122
-
123
-
124
-
125
-
126
-
127
-
128
-
129
-
130
-
131
-
132
-
133
-
134
-
135
-
136
-
137
-
138
-
139
-
140
-
141
-
142
-
143
-
144
-
145
-
146
-
147
-
148
-
149
-
150
-
151
-
152
-
153
-
154
-
155
-
156
-
157
-
158
-
159
-
160
-
161
-
162
-
163
-
164
-
165
-
166
-
167
-
168
-
169
-
170
-
171
-
172
-
173
-
174
-
175
-
176
-
177
-
178
-
179
-
180
-
181
-
182
-
183
-
184
-
185
-
186
-
187
-
188
-
189
-
190
-
191
-
192
-
193
-
194
-
195
-
196
-
197
-
198
-
199
-
200
-
201
-
202
-
203
-
204
-
205
-
206
-
207
-
208
-
209
-
210
-
211
-
212
-
213
-
214
-
215
-
216
-
217
-
218
-
219
-
220
-
221
-
222
-
223
-
224
-
225
-
226
-
227
-
228
-
229
-
230
-
231
-
232
-
233
-
234
-
235
-
236
-
237
-
238
-
239
-
240
-
241
-
242
-
243
-
244
-
245
-
246
-
247
-
248
-
249
-
250
-
251
-
252
-
253
-
254
-
255
-
256
-
257
-
258
-
259
-
260
-
261
-
262
-
263
-
264
-
265
-
266
-
267
-
268
-
269
-
270
-
271
-
272
-
273
-
274
-
275
-
276
-
277
-
278
-
279
-
280
-
281
-
282
-
283
-
284
-
285
-
286
-
287
-
288
-
289
-
290
-
291
-
292
-
293
-
294
-
295
-
296
-
297
-
298
-
299
-
300
-
301
-
302
-
303
-
304
-
305
-
306
-
307
-
308
-
309
-
310
-
311
-
312
-
313
-
314
-
315
-
316
-
317
-
318
-
319
-
320
-
321
-
322
-
323
-
324
-
325
-
326
-
327
-
328
-
329
-
330
-
331
-
332
-
333
-
334
-
335
-
336
-
337
-
338
-
339
-
340
-
341
-
342
-
343
-
344
-
345
-
346
-
347
-
348
-
349
-
350
-
351
-
352
-
353
-
354
-
355
-
356
-
357
-
358
-
359
-
360
-
361
-
362
-
363
-
364
-
365
-
366
-
367
-
368
-
369
-
370
-
371
-
372
-
373
-
374
-
375
-
376
-
377
-
378
-
379
-
380
-
381
-
382
-
383
-
384
-
385
-
386
 |
 |

Table of Contents
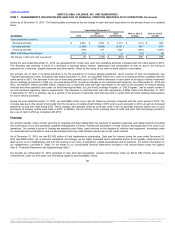
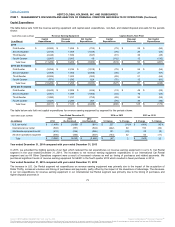
The table below sets forth the revenue earning equipment and capital asset expenditures, non-fleet, and related disposal proceeds for the periods
shown:
First Quarter $ (2,582)
$ 1,859
$ (723)
$ (75)
$ 25
$ (50)
Second Quarter (3,414)
1,858
(1,556)
(76)
20
(56)
Third Quarter (2,446)
1,599
(847)
(81)
36
(45)
Fourth Quarter (2,847)
2,893
46
(142)
12
(130)
Total Year $ (11,289)
$ 8,209
$ (3,080)
$ (374)
$ 93
$ (281)
First Quarter $ (3,254)
$ 2,236
$ (1,018)
$ (78)
$ 24
$ (54)
Second Quarter (3,558)
1,502
(2,056)
(88)
21
(67)
Third Quarter (2,506)
1,923
(583)
(85)
21
(64)
Fourth Quarter (971)
1,595
624
(76)
15
(61)
Total Year $ (10,289)
$ 7,256
$ (3,033)
$ (327)
$ 81
$ (246)
First Quarter $ (2,643)
$ 2,009
$ (634)
$ (74)
$ 49
$ (25)
Second Quarter (3,051)
1,599
(1,452)
(63)
10
(53)
Third Quarter (1,990)
1,231
(759)
(85)
30
(55)
Fourth Quarter (1,927)
2,284
357
(76)
36
(40)
Total Year $ (9,611)
$ 7,123
$ (2,488)
$ (298)
$ 125
$ (173)
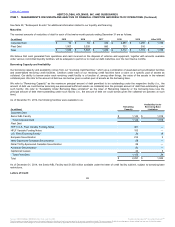
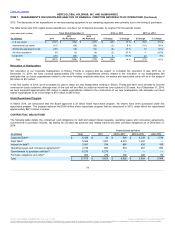
The table below sets forth net capital expenditures for revenue earning equipment by segment for the periods shown:
U.S. car rental $ (1,458)
$ (1,695)
$ (891)
$ 237
(14)%
$ (804)
90 %
International car rental (593)
(351)
(504)
(242)
69
153
(30)
Worldwide equipment rental (433)
(534)
(586)
101
(19)
52
(9)
All other operations segment (596)
(453)
(507)
(143)
32
54
(11)
Total $ (3,080)
$ (3,033)
$ (2,488)
$ (47)
2
$ (545)
22
In 2013, we extended the holding periods of our fleet which reduced the net expenditures on revenue earning equipment in our U.S. Car Rental
segment in the year ended December 31, 2014. The increases to net revenue earning equipment expenditures in our International Car Rental
segment and our All Other Operations segment were a result of increased volumes as well as timing of purchases and related payments. We
purchased significant levels of revenue earning equipment for HERC in the fourth quarter 2013 which resulted in fewer purchases in 2014.
The increase in U.S. Car Rental segment net expenditures on revenue earning equipment was primarily due to the impact of the acquisition of
Dollar Thrifty, increased volumes and timing of purchases and payments, partly offset by the impact of the divestiture of Advantage. The decrease
in our net expenditures for revenue earning equipment in our International Car Rental segment was primarily due to the timing of purchases and
higher disposal proceeds in
73
Source: HERTZ GLOBAL HOLDINGS INC, 10-K, July 16, 2015 Powered by Morningstar® Document Research℠
The information contained herein may not be copied, adapted or distributed and is not warranted to be accurate, complete or timely. The user assumes all risks for any damages or losses arising from any use of this information,
except to the extent such damages or losses cannot be limited or excluded by applicable law. Past financial performance is no guarantee of future results.