Hertz 2014 Annual Report Download - page 52
Download and view the complete annual report
Please find page 52 of the 2014 Hertz annual report below. You can navigate through the pages in the report by either clicking on the pages listed below, or by using the keyword search tool below to find specific information within the annual report.-
 1
1 -
2
-
3
-
4
-
5
-
6
-
7
-
8
-
9
-
10
-
11
-
12
-
13
-
14
-
15
-
16
-
17
-
18
-
19
-
20
-
21
-
22
-
23
-
24
-
25
-
26
-
27
-
28
-
29
-
30
-
31
-
32
-
33
-
34
-
35
-
36
-
37
-
38
-
39
-
40
-
41
-
 42
42 -
 43
43 -
 44
44 -
 45
45 -
 46
46 -
 47
47 -
 48
48 -
 49
49 -
 50
50 -
 51
51 -
 52
52 -
 53
53 -
 54
54 -
 55
55 -
 56
56 -
 57
57 -
 58
58 -
 59
59 -
 60
60 -
 61
61 -
 62
62 -
63
-
64
-
65
-
66
-
67
-
68
-
69
-
70
-
71
-
72
-
73
-
74
-
75
-
76
-
77
-
78
-
79
-
80
-
81
-
82
-
83
-
84
-
85
-
86
-
87
-
88
-
89
-
90
-
91
-
92
-
93
-
94
-
95
-
96
-
97
-
98
-
99
-
100
-
101
-
102
-
103
-
104
-
105
-
106
-
107
-
108
-
109
-
110
-
111
-
112
-
113
-
114
-
115
-
116
-
117
-
118
-
119
-
120
-
121
-
122
-
123
-
124
-
125
-
126
-
127
-
128
-
129
-
130
-
131
-
132
-
133
-
134
-
135
-
136
-
137
-
138
-
139
-
140
-
141
-
142
-
143
-
144
-
145
-
146
-
147
-
148
-
149
-
150
-
151
-
152
-
153
-
154
-
155
-
156
-
157
-
158
-
159
-
160
-
161
-
162
-
163
-
164
-
165
-
166
-
167
-
168
-
169
-
170
-
171
-
172
-
173
-
174
-
175
-
176
-
177
-
178
-
179
-
180
-
181
-
182
-
183
-
184
-
185
-
186
-
187
-
188
-
189
-
190
-
191
-
192
-
193
-
194
-
195
-
196
-
197
-
198
-
199
-
200
-
201
-
202
-
203
-
204
-
205
-
206
-
207
-
208
-
209
-
210
-
211
-
212
-
213
-
214
-
215
-
216
-
217
-
218
-
219
-
220
-
221
-
222
-
223
-
224
-
225
-
226
-
227
-
228
-
229
-
230
-
231
-
232
-
233
-
234
-
235
-
236
-
237
-
238
-
239
-
240
-
241
-
242
-
243
-
244
-
245
-
246
-
247
-
248
-
249
-
250
-
251
-
252
-
253
-
254
-
255
-
256
-
257
-
258
-
259
-
260
-
261
-
262
-
263
-
264
-
265
-
266
-
267
-
268
-
269
-
270
-
271
-
272
-
273
-
274
-
275
-
276
-
277
-
278
-
279
-
280
-
281
-
282
-
283
-
284
-
285
-
286
-
287
-
288
-
289
-
290
-
291
-
292
-
293
-
294
-
295
-
296
-
297
-
298
-
299
-
300
-
301
-
302
-
303
-
304
-
305
-
306
-
307
-
308
-
309
-
310
-
311
-
312
-
313
-
314
-
315
-
316
-
317
-
318
-
319
-
320
-
321
-
322
-
323
-
324
-
325
-
326
-
327
-
328
-
329
-
330
-
331
-
332
-
333
-
334
-
335
-
336
-
337
-
338
-
339
-
340
-
341
-
342
-
343
-
344
-
345
-
346
-
347
-
348
-
349
-
350
-
351
-
352
-
353
-
354
-
355
-
356
-
357
-
358
-
359
-
360
-
361
-
362
-
363
-
364
-
365
-
366
-
367
-
368
-
369
-
370
-
371
-
372
-
373
-
374
-
375
-
376
-
377
-
378
-
379
-
380
-
381
-
382
-
383
-
384
-
385
-
386
 |
 |

Table of Contents
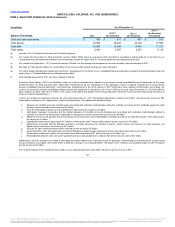
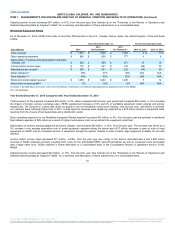
In addition to the above reportable segments, the Company has corporate operations ("Corporate") which includes general corporate assets and
expenses and certain interest expense (including net interest on corporate debt). We assess performance and allocate resources based upon the
financial information for our operating segments.
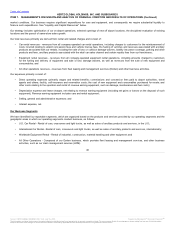
Our car rental and equipment rental operations are seasonal businesses, with decreased levels of business in the winter months and heightened
activity during the spring and summer. We have the ability to dynamically manage fleet capacity, the most significant portion of our cost structure,
to meet market demand. For instance, to accommodate increased demand, we increase our available fleet and staff during the second and third
quarters of the year. As business demand declines, fleet and staff are decreased accordingly. A number of our other major operating costs,
including airport concession fees, commissions and vehicle liability expenses, are directly related to revenues or transaction volumes. In addition,
our management expects to utilize enhanced process improvements, including efficiency initiatives and the use of our information technology
systems, to help manage our variable costs. More than half of our typical annual operating costs represent variable costs, while the remaining
costs are fixed or semi-fixed. We also maintain a flexible workforce, with a significant number of part time and seasonal workers. However, certain
operating expenses, including rent, insurance, and administrative overhead, remain fixed and cannot be adjusted for seasonal demand. Revenues
related to our fleet leasing and management services are generally not seasonal.
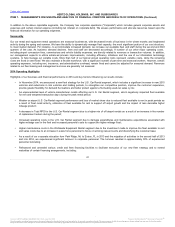
Highlights of our business and financial performance in 2014 and key factors influencing our results include:
• In November 2014, we announced a new fleet strategy for the U.S. Car Rental segment, which includes a significant increase in new 2015
vehicles and reductions in risk vehicles and holding periods, to strengthen our competitive position, improve the customer experience,
provide greater flexibility for demand fluctuations and better protect against a fluctuating used-car sales cycle;
• An unprecedented level of vehicle manufacturer recalls affecting our U.S. Car Rental segment, which negatively impacted fleet available
for rent and tempered transaction days during the peak rental period;
• Weaker on airport U.S. Car Rental segment performance and loss of market share due to reduced fleet available to rent in peak periods as
a result of fleet recall activity, utilization of fleet available for rent to support off airport growth and the impact of less desirable higher
mileage product;
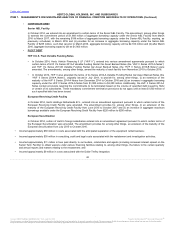
• A decrease in Total RPD for the U.S. Car Rental segment due to a higher mix of off airport rentals as a result of an increase in the number
of replacement renters during the period;
• Increased operating costs in the U.S. Car Rental segment due to damage expenditures and maintenance expenditures associated with
higher mileage cars in the fleet and increased personnel costs to support the higher mileage fleet;
• Higher maintenance costs in the Worldwide Equipment Rental segment due to the investment made to improve the fleet available to rent
and sales costs due to an increase in sales force personnel to focus on winning new accounts and diversifying the customer base;
• As a result of our corporate relocation from Park Ridge, NJ to Estero, FL in 2013 and the migration of activities in the second half of 2013
and into 2014, we experienced significant turnover in corporate personnel. The turnover resulted in approximately 30% of experienced
personnel relocating;
• Refinanced and amended various credit and fleet financing facilities to facilitate execution of our new fleet strategy and to extend
maturities of certain financing arrangements, including:
41
Source: HERTZ GLOBAL HOLDINGS INC, 10-K, July 16, 2015 Powered by Morningstar® Document Research℠
The information contained herein may not be copied, adapted or distributed and is not warranted to be accurate, complete or timely. The user assumes all risks for any damages or losses arising from any use of this information,
except to the extent such damages or losses cannot be limited or excluded by applicable law. Past financial performance is no guarantee of future results.