Hertz 2014 Annual Report Download - page 176
Download and view the complete annual report
Please find page 176 of the 2014 Hertz annual report below. You can navigate through the pages in the report by either clicking on the pages listed below, or by using the keyword search tool below to find specific information within the annual report.-
 1
1 -
2
-
3
-
4
-
5
-
6
-
7
-
8
-
9
-
10
-
11
-
12
-
13
-
14
-
15
-
16
-
17
-
18
-
19
-
20
-
21
-
22
-
23
-
24
-
25
-
26
-
27
-
28
-
29
-
30
-
31
-
32
-
33
-
34
-
35
-
36
-
37
-
38
-
39
-
40
-
41
-
42
-
43
-
44
-
45
-
46
-
47
-
48
-
49
-
50
-
51
-
52
-
53
-
54
-
55
-
56
-
57
-
58
-
59
-
60
-
61
-
62
-
63
-
64
-
65
-
66
-
67
-
68
-
69
-
70
-
71
-
72
-
73
-
74
-
75
-
76
-
77
-
78
-
79
-
80
-
81
-
82
-
83
-
84
-
85
-
86
-
87
-
88
-
89
-
90
-
91
-
92
-
93
-
94
-
95
-
96
-
97
-
98
-
99
-
100
-
101
-
102
-
103
-
104
-
105
-
106
-
107
-
108
-
109
-
110
-
111
-
112
-
113
-
114
-
115
-
116
-
117
-
118
-
119
-
120
-
121
-
122
-
123
-
124
-
125
-
126
-
127
-
128
-
129
-
130
-
131
-
132
-
133
-
134
-
135
-
136
-
137
-
138
-
139
-
140
-
141
-
142
-
143
-
144
-
145
-
146
-
147
-
148
-
149
-
150
-
151
-
152
-
153
-
154
-
155
-
156
-
157
-
158
-
159
-
160
-
161
-
162
-
163
-
164
-
165
-
 166
166 -
 167
167 -
 168
168 -
 169
169 -
 170
170 -
 171
171 -
 172
172 -
 173
173 -
 174
174 -
 175
175 -
 176
176 -
 177
177 -
 178
178 -
 179
179 -
 180
180 -
 181
181 -
 182
182 -
 183
183 -
 184
184 -
 185
185 -
 186
186 -
187
-
188
-
189
-
190
-
191
-
192
-
193
-
194
-
195
-
196
-
197
-
198
-
199
-
200
-
201
-
202
-
203
-
204
-
205
-
206
-
207
-
208
-
209
-
210
-
211
-
212
-
213
-
214
-
215
-
216
-
217
-
218
-
219
-
220
-
221
-
222
-
223
-
224
-
225
-
226
-
227
-
228
-
229
-
230
-
231
-
232
-
233
-
234
-
235
-
236
-
237
-
238
-
239
-
240
-
241
-
242
-
243
-
244
-
245
-
246
-
247
-
248
-
249
-
250
-
251
-
252
-
253
-
254
-
255
-
256
-
257
-
258
-
259
-
260
-
261
-
262
-
263
-
264
-
265
-
266
-
267
-
268
-
269
-
270
-
271
-
272
-
273
-
274
-
275
-
276
-
277
-
278
-
279
-
280
-
281
-
282
-
283
-
284
-
285
-
286
-
287
-
288
-
289
-
290
-
291
-
292
-
293
-
294
-
295
-
296
-
297
-
298
-
299
-
300
-
301
-
302
-
303
-
304
-
305
-
306
-
307
-
308
-
309
-
310
-
311
-
312
-
313
-
314
-
315
-
316
-
317
-
318
-
319
-
320
-
321
-
322
-
323
-
324
-
325
-
326
-
327
-
328
-
329
-
330
-
331
-
332
-
333
-
334
-
335
-
336
-
337
-
338
-
339
-
340
-
341
-
342
-
343
-
344
-
345
-
346
-
347
-
348
-
349
-
350
-
351
-
352
-
353
-
354
-
355
-
356
-
357
-
358
-
359
-
360
-
361
-
362
-
363
-
364
-
365
-
366
-
367
-
368
-
369
-
370
-
371
-
372
-
373
-
374
-
375
-
376
-
377
-
378
-
379
-
380
-
381
-
382
-
383
-
384
-
385
-
386
 |
 |
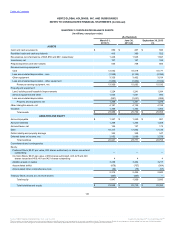
Table of Contents
The fair value of cash, accounts receivable, accounts payable and accrued expenses, to the extent the underlying liability will be settled in cash,
approximate carrying values because of the short-term nature of these instruments. The Company's assessment of goodwill and other intangible
assets for impairment includes an assessment using various Level 2 (EBITDA multiples and discount rate) and Level 3 (forecasted cash flows)
inputs. See Note 3 Summary of Critical and Significant Accounting Policies" "Recoverability of Goodwill and Intangible Assets," for more
information on the application of the use of fair value methodology.
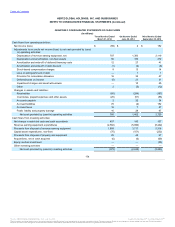
Cash Equivalents and Investments
The Company’s cash equivalents primarily consist of money market accounts which the Company measures at fair value on a recurring basis. The
Company determines the fair value of cash equivalents using a market approach based on quoted prices in active markets.
Investments in equity and other securities that are measured at fair value on a recurring basis consist of various mutual funds. The valuation of
these securities is based on pricing models whereby all significant inputs are observable or can be derived from or corroborated by observable
market data.
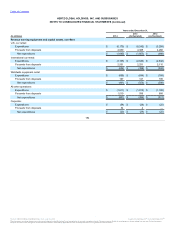
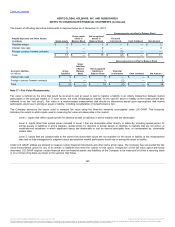
The following table summarizes the ending balances of the Company's cash equivalents and investments.
Money market funds
$ 146
$ —
$ —
$ 146
$ 449
$ —
$ —
$ 449
Equity and other securities
—
96
—
96
—
117
—
117
Marketable securities
—
—
—
—
—
—
151
151
Total
$ 146
$ 96
$ —
$ 242
$ 449
$ 117
$ 151
$ 717
As of December 31, 2014, the Company held a 16.2% equity investment in CAR, Inc., a publicly held company trading on the Hong Kong Stock
Exchange, which is accounted for under the the equity method. The Company's net investment balance was approximately $264 million as of
December 31, 2014, and is included in "Prepaid expenses and other assets" in the accompanying consolidated balance sheet. The fair value of
the investment using quoted market prices (Level 1) was approximately $514 million as of December 31, 2014.
Marketable securities held by the Company as of December 31, 2013 consisted of convertible debt securities of CAR, Inc. which were classified
as available-for-sale and which were carried at fair value within "Prepaid expenses and other assets." Unrealized gains and losses, net of related
income taxes, associated with its investment were included in "Accumulated other comprehensive income." In April 2014, the Company converted
all of its debt securities into additional equity of CAR, Inc. - see Note 5, "Acquisitions and Divestitures."
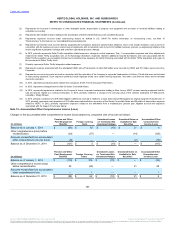
The following table summarizes the changes in fair value of CAR, Inc. convertible debt securities prior to conversion in April 2014, using Level 3
inputs (binomial valuation model) for the years ended December 31, 2014 and 2013, respectively:
164
Source: HERTZ GLOBAL HOLDINGS INC, 10-K, July 16, 2015 Powered by Morningstar® Document Research℠
The information contained herein may not be copied, adapted or distributed and is not warranted to be accurate, complete or timely. The user assumes all risks for any damages or losses arising from any use of this information,
except to the extent such damages or losses cannot be limited or excluded by applicable law. Past financial performance is no guarantee of future results.