Hertz 2014 Annual Report Download - page 86
Download and view the complete annual report
Please find page 86 of the 2014 Hertz annual report below. You can navigate through the pages in the report by either clicking on the pages listed below, or by using the keyword search tool below to find specific information within the annual report.-
 1
1 -
2
-
3
-
4
-
5
-
6
-
7
-
8
-
9
-
10
-
11
-
12
-
13
-
14
-
15
-
16
-
17
-
18
-
19
-
20
-
21
-
22
-
23
-
24
-
25
-
26
-
27
-
28
-
29
-
30
-
31
-
32
-
33
-
34
-
35
-
36
-
37
-
38
-
39
-
40
-
41
-
42
-
43
-
44
-
45
-
46
-
47
-
48
-
49
-
50
-
51
-
52
-
53
-
54
-
55
-
56
-
57
-
58
-
59
-
60
-
61
-
62
-
63
-
64
-
65
-
66
-
67
-
68
-
69
-
70
-
71
-
72
-
73
-
74
-
75
-
 76
76 -
 77
77 -
 78
78 -
 79
79 -
 80
80 -
 81
81 -
 82
82 -
 83
83 -
 84
84 -
 85
85 -
 86
86 -
 87
87 -
 88
88 -
 89
89 -
 90
90 -
 91
91 -
 92
92 -
 93
93 -
 94
94 -
 95
95 -
 96
96 -
97
-
98
-
99
-
100
-
101
-
102
-
103
-
104
-
105
-
106
-
107
-
108
-
109
-
110
-
111
-
112
-
113
-
114
-
115
-
116
-
117
-
118
-
119
-
120
-
121
-
122
-
123
-
124
-
125
-
126
-
127
-
128
-
129
-
130
-
131
-
132
-
133
-
134
-
135
-
136
-
137
-
138
-
139
-
140
-
141
-
142
-
143
-
144
-
145
-
146
-
147
-
148
-
149
-
150
-
151
-
152
-
153
-
154
-
155
-
156
-
157
-
158
-
159
-
160
-
161
-
162
-
163
-
164
-
165
-
166
-
167
-
168
-
169
-
170
-
171
-
172
-
173
-
174
-
175
-
176
-
177
-
178
-
179
-
180
-
181
-
182
-
183
-
184
-
185
-
186
-
187
-
188
-
189
-
190
-
191
-
192
-
193
-
194
-
195
-
196
-
197
-
198
-
199
-
200
-
201
-
202
-
203
-
204
-
205
-
206
-
207
-
208
-
209
-
210
-
211
-
212
-
213
-
214
-
215
-
216
-
217
-
218
-
219
-
220
-
221
-
222
-
223
-
224
-
225
-
226
-
227
-
228
-
229
-
230
-
231
-
232
-
233
-
234
-
235
-
236
-
237
-
238
-
239
-
240
-
241
-
242
-
243
-
244
-
245
-
246
-
247
-
248
-
249
-
250
-
251
-
252
-
253
-
254
-
255
-
256
-
257
-
258
-
259
-
260
-
261
-
262
-
263
-
264
-
265
-
266
-
267
-
268
-
269
-
270
-
271
-
272
-
273
-
274
-
275
-
276
-
277
-
278
-
279
-
280
-
281
-
282
-
283
-
284
-
285
-
286
-
287
-
288
-
289
-
290
-
291
-
292
-
293
-
294
-
295
-
296
-
297
-
298
-
299
-
300
-
301
-
302
-
303
-
304
-
305
-
306
-
307
-
308
-
309
-
310
-
311
-
312
-
313
-
314
-
315
-
316
-
317
-
318
-
319
-
320
-
321
-
322
-
323
-
324
-
325
-
326
-
327
-
328
-
329
-
330
-
331
-
332
-
333
-
334
-
335
-
336
-
337
-
338
-
339
-
340
-
341
-
342
-
343
-
344
-
345
-
346
-
347
-
348
-
349
-
350
-
351
-
352
-
353
-
354
-
355
-
356
-
357
-
358
-
359
-
360
-
361
-
362
-
363
-
364
-
365
-
366
-
367
-
368
-
369
-
370
-
371
-
372
-
373
-
374
-
375
-
376
-
377
-
378
-
379
-
380
-
381
-
382
-
383
-
384
-
385
-
386
 |
 |
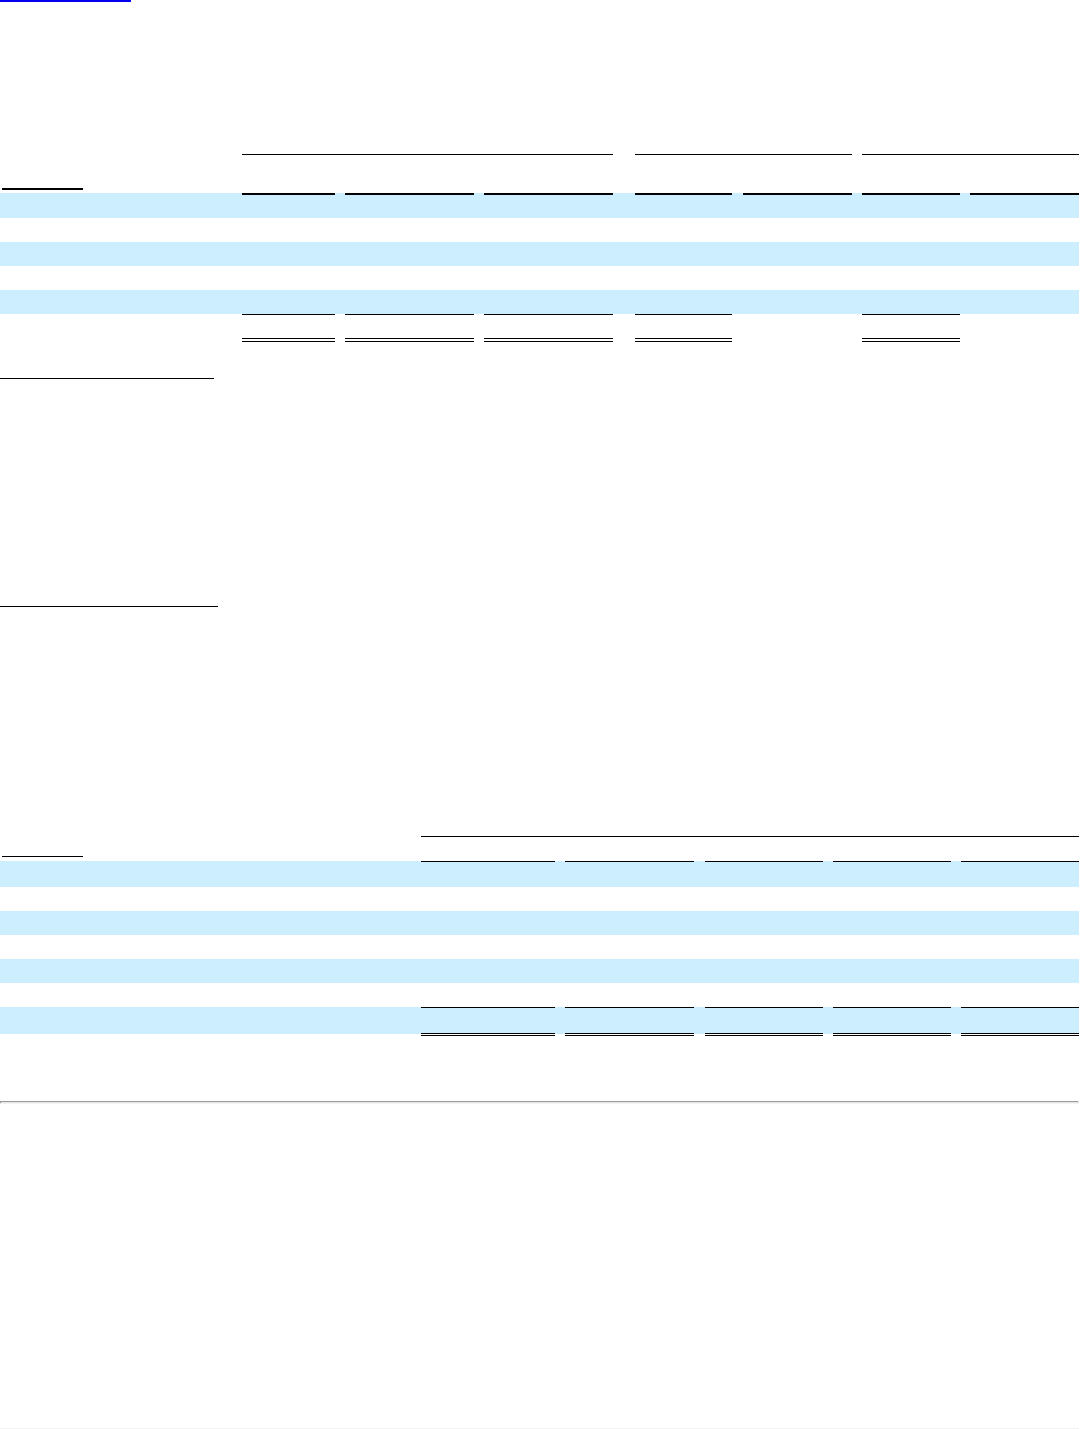
Table of Contents
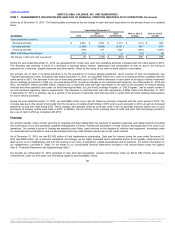
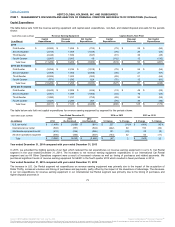
2013. The decreases in net expenditures on revenue earning equipment in our remaining segments were primarily due to the timing of purchases.
The table below sets forth capital asset expenditures, non-fleet, net of disposal proceeds, by segment for the periods shown:
U.S. car rental $ (187)
$ (162)
$ (107)
$ (25)
15 %
$ (55)
51 %
International car rental (41)
(38)
(28)
(3)
8 %
(10)
36 %
Worldwide equipment rental (28)
(19)
(12)
(9)
47 %
(7)
58 %
All other operations (5)
(3)
(4)
(2)
67 %
1
(25)%
Corporate (20)
(24)
(22)
4
(17)%
(2)
9 %
Total $ (281)
$ (246)
$ (173)
$ (35)
14 %
$ (73)
42 %
Our relocation of our corporate headquarters to Estero, Florida is ongoing and we expect to complete the relocation in late 2015. As of
December 31, 2014, we have incurred approximately $74 million in expenditures directly related to the relocation of our headquarters. We
anticipate that our future expenditures related to the move including employee relocation, severance and associated costs will be in the range of
$8 million to $12 million.
In the first quarter of 2014, we re-evaluated our plan to lease our new headquarters building in Estero, Florida and have since decided to fund the
construction costs ourselves, although most of the cost will be offset by state tax incentives over a period of 20 years. As of December 31, 2014,
we have expended approximately $33 million in capital expenditures related to the construction of our new headquarters. We anticipate our future
capital expenditures to be in the range of $70 million to $80 million.
In March 2014, we announced that the Board approved a $1 billion share repurchase program. No shares have been purchased under this
repurchase program. The program replaced the $300 million share repurchase program that we announced in 2013, under which we repurchased
approximately $87.5 million in shares.
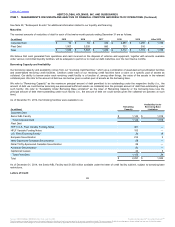
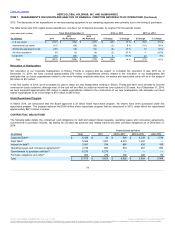
The following table details the contractual cash obligations for debt and related interest payable, operating leases and concession agreements,
commitments to purchase vehicles, tax liability for uncertain tax positions and related interest and other purchase obligations as of December 31,
2014:
Corporate Debt(a) $ 6,428
$ 32
$ 408
$ 4,239
$ 1,749
Fleet Debt(a) 9,569
1,907
6,415
1,247
—
Interest on debt(b) 2,041
534
895
432
180
Operating leases and concession agreements(c) 2,736
603
810
467
856
Commitments to purchase vehicles(d) 6,275
6,275
—
—
—
Purchase obligations and other(e) 864
272
300
209
83
Total $ 27,913
$ 9,623
$ 8,828
$ 6,594
$ 2,868
74
Source: HERTZ GLOBAL HOLDINGS INC, 10-K, July 16, 2015 Powered by Morningstar® Document Research℠
The information contained herein may not be copied, adapted or distributed and is not warranted to be accurate, complete or timely. The user assumes all risks for any damages or losses arising from any use of this information,
except to the extent such damages or losses cannot be limited or excluded by applicable law. Past financial performance is no guarantee of future results.