Hertz 2014 Annual Report Download - page 112
Download and view the complete annual report
Please find page 112 of the 2014 Hertz annual report below. You can navigate through the pages in the report by either clicking on the pages listed below, or by using the keyword search tool below to find specific information within the annual report.-
 1
1 -
2
-
3
-
4
-
5
-
6
-
7
-
8
-
9
-
10
-
11
-
12
-
13
-
14
-
15
-
16
-
17
-
18
-
19
-
20
-
21
-
22
-
23
-
24
-
25
-
26
-
27
-
28
-
29
-
30
-
31
-
32
-
33
-
34
-
35
-
36
-
37
-
38
-
39
-
40
-
41
-
42
-
43
-
44
-
45
-
46
-
47
-
48
-
49
-
50
-
51
-
52
-
53
-
54
-
55
-
56
-
57
-
58
-
59
-
60
-
61
-
62
-
63
-
64
-
65
-
66
-
67
-
68
-
69
-
70
-
71
-
72
-
73
-
74
-
75
-
76
-
77
-
78
-
79
-
80
-
81
-
82
-
83
-
84
-
85
-
86
-
87
-
88
-
89
-
90
-
91
-
92
-
93
-
94
-
95
-
96
-
97
-
98
-
99
-
100
-
101
-
 102
102 -
 103
103 -
 104
104 -
 105
105 -
 106
106 -
 107
107 -
 108
108 -
 109
109 -
 110
110 -
 111
111 -
 112
112 -
 113
113 -
 114
114 -
 115
115 -
 116
116 -
 117
117 -
 118
118 -
 119
119 -
 120
120 -
 121
121 -
 122
122 -
123
-
124
-
125
-
126
-
127
-
128
-
129
-
130
-
131
-
132
-
133
-
134
-
135
-
136
-
137
-
138
-
139
-
140
-
141
-
142
-
143
-
144
-
145
-
146
-
147
-
148
-
149
-
150
-
151
-
152
-
153
-
154
-
155
-
156
-
157
-
158
-
159
-
160
-
161
-
162
-
163
-
164
-
165
-
166
-
167
-
168
-
169
-
170
-
171
-
172
-
173
-
174
-
175
-
176
-
177
-
178
-
179
-
180
-
181
-
182
-
183
-
184
-
185
-
186
-
187
-
188
-
189
-
190
-
191
-
192
-
193
-
194
-
195
-
196
-
197
-
198
-
199
-
200
-
201
-
202
-
203
-
204
-
205
-
206
-
207
-
208
-
209
-
210
-
211
-
212
-
213
-
214
-
215
-
216
-
217
-
218
-
219
-
220
-
221
-
222
-
223
-
224
-
225
-
226
-
227
-
228
-
229
-
230
-
231
-
232
-
233
-
234
-
235
-
236
-
237
-
238
-
239
-
240
-
241
-
242
-
243
-
244
-
245
-
246
-
247
-
248
-
249
-
250
-
251
-
252
-
253
-
254
-
255
-
256
-
257
-
258
-
259
-
260
-
261
-
262
-
263
-
264
-
265
-
266
-
267
-
268
-
269
-
270
-
271
-
272
-
273
-
274
-
275
-
276
-
277
-
278
-
279
-
280
-
281
-
282
-
283
-
284
-
285
-
286
-
287
-
288
-
289
-
290
-
291
-
292
-
293
-
294
-
295
-
296
-
297
-
298
-
299
-
300
-
301
-
302
-
303
-
304
-
305
-
306
-
307
-
308
-
309
-
310
-
311
-
312
-
313
-
314
-
315
-
316
-
317
-
318
-
319
-
320
-
321
-
322
-
323
-
324
-
325
-
326
-
327
-
328
-
329
-
330
-
331
-
332
-
333
-
334
-
335
-
336
-
337
-
338
-
339
-
340
-
341
-
342
-
343
-
344
-
345
-
346
-
347
-
348
-
349
-
350
-
351
-
352
-
353
-
354
-
355
-
356
-
357
-
358
-
359
-
360
-
361
-
362
-
363
-
364
-
365
-
366
-
367
-
368
-
369
-
370
-
371
-
372
-
373
-
374
-
375
-
376
-
377
-
378
-
379
-
380
-
381
-
382
-
383
-
384
-
385
-
386
 |
 |

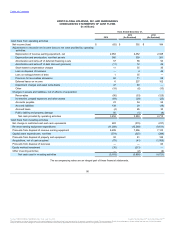
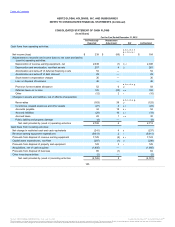
Table of Contents
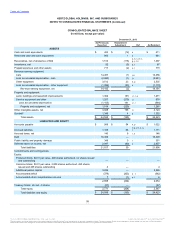
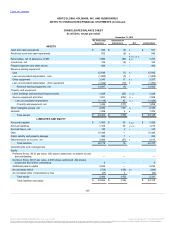
Cash and cash equivalents $ 546
$ (5)
k
$ 541
Restricted cash and cash equivalents 552
(6)
k
546
Receivables, net of allowance of $53 1,880
(93)
a, b, c, d, e,
g, j, r
1,787
Inventories, net 106
(4)
r
102
Prepaid expenses and other assets 488
—
r
488
Revenue earning equipment:
Cars 12,549
(7)
f, r
12,542
Less accumulated depreciation - cars (1,850)
(5)
f
(1,855)
Other equipment 3,240
17
h, r
3,257
Less accumulated depreciation - other equipment (1,042)
(10)
h
(1,052)
Revenue earning equipment, net 12,897
(5)
12,892
Property and equipment:
Land, buildings and leasehold improvements 1,289
(65)
i, r, q
1,224
Service equipment and other 1,261
(202)
i, l, r
1,059
Less accumulated depreciation (1,114)
90
i, l, r
(1,024)
Property and equipment, net 1,436
(177)
1,259
Other intangible assets, net 4,030
150
l, r
4,180
Goodwill 1,329
4
q
1,333
Total assets $ 23,264
$ (136)
$ 23,128
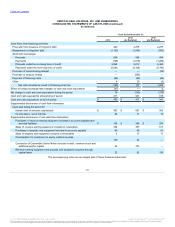
Accounts payable $ 1,003
$ 33
k, p, r
$ 1,036
Accrued liabilities 1,163
50
j, o, q, r
1,213
Accrued taxes, net 145
2
r
147
Debt 15,449
—
15,449
Public liability and property damage 332
1
r
333
Deferred taxes on income, net 2,686
(67)
s
2,619
Total liabilities 20,778
19
20,797
Commitments and contingencies
Equity:
Preferred Stock, $0.01 par value, 200 shares authorized, no shares issued
and outstanding —
—
—
Common Stock, $0.01 par value, 2,000 shares authorized, 422 shares
issued and 422 million outstanding 4
—
4
Additional paid-in capital 3,234
—
3,234
Accumulated deficit (725)
(159)
a-t
(884)
Accumulated other comprehensive loss (27)
4
t
(23)
Total equity 2,486
(155)
2,331
Total liabilities and equity $ 23,264
$ (136)
$ 23,128
100
Source: HERTZ GLOBAL HOLDINGS INC, 10-K, July 16, 2015 Powered by Morningstar® Document Research℠
The information contained herein may not be copied, adapted or distributed and is not warranted to be accurate, complete or timely. The user assumes all risks for any damages or losses arising from any use of this information,
except to the extent such damages or losses cannot be limited or excluded by applicable law. Past financial performance is no guarantee of future results.