Hertz 2014 Annual Report Download - page 80
Download and view the complete annual report
Please find page 80 of the 2014 Hertz annual report below. You can navigate through the pages in the report by either clicking on the pages listed below, or by using the keyword search tool below to find specific information within the annual report.-
 1
1 -
2
-
3
-
4
-
5
-
6
-
7
-
8
-
9
-
10
-
11
-
12
-
13
-
14
-
15
-
16
-
17
-
18
-
19
-
20
-
21
-
22
-
23
-
24
-
25
-
26
-
27
-
28
-
29
-
30
-
31
-
32
-
33
-
34
-
35
-
36
-
37
-
38
-
39
-
40
-
41
-
42
-
43
-
44
-
45
-
46
-
47
-
48
-
49
-
50
-
51
-
52
-
53
-
54
-
55
-
56
-
57
-
58
-
59
-
60
-
61
-
62
-
63
-
64
-
65
-
66
-
67
-
68
-
69
-
 70
70 -
 71
71 -
 72
72 -
 73
73 -
 74
74 -
 75
75 -
 76
76 -
 77
77 -
 78
78 -
 79
79 -
 80
80 -
 81
81 -
 82
82 -
 83
83 -
 84
84 -
 85
85 -
 86
86 -
 87
87 -
 88
88 -
 89
89 -
 90
90 -
91
-
92
-
93
-
94
-
95
-
96
-
97
-
98
-
99
-
100
-
101
-
102
-
103
-
104
-
105
-
106
-
107
-
108
-
109
-
110
-
111
-
112
-
113
-
114
-
115
-
116
-
117
-
118
-
119
-
120
-
121
-
122
-
123
-
124
-
125
-
126
-
127
-
128
-
129
-
130
-
131
-
132
-
133
-
134
-
135
-
136
-
137
-
138
-
139
-
140
-
141
-
142
-
143
-
144
-
145
-
146
-
147
-
148
-
149
-
150
-
151
-
152
-
153
-
154
-
155
-
156
-
157
-
158
-
159
-
160
-
161
-
162
-
163
-
164
-
165
-
166
-
167
-
168
-
169
-
170
-
171
-
172
-
173
-
174
-
175
-
176
-
177
-
178
-
179
-
180
-
181
-
182
-
183
-
184
-
185
-
186
-
187
-
188
-
189
-
190
-
191
-
192
-
193
-
194
-
195
-
196
-
197
-
198
-
199
-
200
-
201
-
202
-
203
-
204
-
205
-
206
-
207
-
208
-
209
-
210
-
211
-
212
-
213
-
214
-
215
-
216
-
217
-
218
-
219
-
220
-
221
-
222
-
223
-
224
-
225
-
226
-
227
-
228
-
229
-
230
-
231
-
232
-
233
-
234
-
235
-
236
-
237
-
238
-
239
-
240
-
241
-
242
-
243
-
244
-
245
-
246
-
247
-
248
-
249
-
250
-
251
-
252
-
253
-
254
-
255
-
256
-
257
-
258
-
259
-
260
-
261
-
262
-
263
-
264
-
265
-
266
-
267
-
268
-
269
-
270
-
271
-
272
-
273
-
274
-
275
-
276
-
277
-
278
-
279
-
280
-
281
-
282
-
283
-
284
-
285
-
286
-
287
-
288
-
289
-
290
-
291
-
292
-
293
-
294
-
295
-
296
-
297
-
298
-
299
-
300
-
301
-
302
-
303
-
304
-
305
-
306
-
307
-
308
-
309
-
310
-
311
-
312
-
313
-
314
-
315
-
316
-
317
-
318
-
319
-
320
-
321
-
322
-
323
-
324
-
325
-
326
-
327
-
328
-
329
-
330
-
331
-
332
-
333
-
334
-
335
-
336
-
337
-
338
-
339
-
340
-
341
-
342
-
343
-
344
-
345
-
346
-
347
-
348
-
349
-
350
-
351
-
352
-
353
-
354
-
355
-
356
-
357
-
358
-
359
-
360
-
361
-
362
-
363
-
364
-
365
-
366
-
367
-
368
-
369
-
370
-
371
-
372
-
373
-
374
-
375
-
376
-
377
-
378
-
379
-
380
-
381
-
382
-
383
-
384
-
385
-
386
 |
 |

Table of Contents
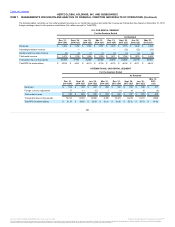
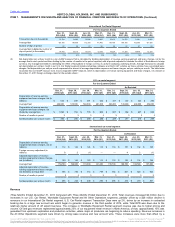
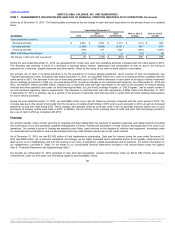
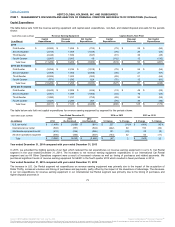
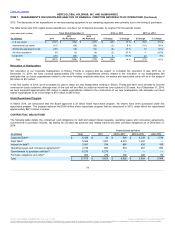
million as of December 31, 2013. The following table summarizes the net change in cash and cash equivalents for the periods shown on a restated
basis:
Cash provided by (used in):
Operating activities $ 3,452
$ 3,593
$ 2,713
$ (141)
$ 880
Investing activities (3,183)
(3,850)
(4,721)
667
871
Financing activities (159)
127
1,624
(286)
(1,497)
Effect of exchange rate changes (31)
—
6
(31)
(6)
Net change in cash and cash equivalents $ 79
$ (130)
$ (378)
$ 209
$ 248
During the year ended December 31, 2014, we generated $141 million less cash from operating activities compared with the same period in 2013.
The decrease was primarily a result of a decrease in earnings before interest, depreciation and amortization as well as due to the timing of
payments for inventories, prepaid expenses and other assets, offset by the timing of our cash receipts related to receivables.
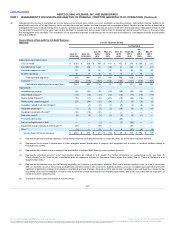
Our primary use of cash in investing activities is for the acquisition of revenue earning equipment, which consists of cars and equipment, see
"Capital Expenditures" below. During the year ended December 31, 2014, we used $667 million less cash for investing activities compared with the
same period in 2013. The decrease in the use of funds was primarily due to a $183 million decrease in cash spent on an equity method investment
(as our strategic investment in CAR, Inc. occurred during 2013), as well as changes in our restricted cash balances. As of December 31, 2014 and
2013, we had $571 million and $861 million, respectively, of restricted cash and cash equivalents to be used for the purchase of revenue earning
vehicles and other specified uses under our fleet financing facilities, our Like Kind Exchange Program, or "LKE Program," and to satisfy certain of
our self-insurance regulatory reserve requirements. The decrease in restricted cash and cash equivalents of $290 million from December 31, 2013
to December 31, 2014, is primarily due to a decline in the amount of restricted cash that was held in certain LKE accounts awaiting disbursement
for future vehicle purchases.
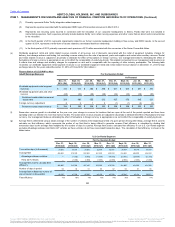
During the year ended December 31, 2014, we used $286 million more cash for financing activities compared with the same period in 2013. The
increase was due to the receipt of proceeds from the issuance of variable fleet funding in 2013 and no such proceeds in 2014, as well as increased
payments on long term debt during 2014. These changes were partially offset as cash was used in 2013 to purchase treasury shares and no such
purchases of treasury shares were made in 2014. In addition, the net activity in the revolving lines of credit and short term borrowings resulted in
less use of cash in 2014 as compared with 2013.
Our primary liquidity needs include servicing of corporate and fleet related debt, the payment of operating expenses and capital projects (including
the construction of our new worldwide corporate headquarters in Estero, Florida) and purchases of rental vehicles and equipment to be used in our
operations. Our primary sources of funding are operating cash flows, cash received on the disposal of vehicles and equipment, borrowings under
our asset-backed securitizations and our asset-based revolving credit facilities and access to the credit markets.
As of December 31, 2014, we had $15,993 million of total indebtedness outstanding. Cash paid for interest during the year ended December 31,
2014 was $562 million, net of amounts capitalized. Accordingly, we are highly leveraged and a substantial portion of our liquidity needs arise from
debt service on our indebtedness and from the funding of our costs of operations, capital expenditures and acquisitions. For further information on
our indebtedness, see Note 6, "Debt," to the Notes to our consolidated financial statements included in this Annual Report under the caption
Item 8, "Financial Statements and Supplementary Data."
Our liquidity as of December 31, 2014 consisted of cash and cash equivalents, unused commitments under our Senior ABL Facility and unused
commitments under our fleet debt, see "Borrowing Capacity and Availability" below.
68
Source: HERTZ GLOBAL HOLDINGS INC, 10-K, July 16, 2015 Powered by Morningstar® Document Research℠
The information contained herein may not be copied, adapted or distributed and is not warranted to be accurate, complete or timely. The user assumes all risks for any damages or losses arising from any use of this information,
except to the extent such damages or losses cannot be limited or excluded by applicable law. Past financial performance is no guarantee of future results.