Hertz 2014 Annual Report Download - page 159
Download and view the complete annual report
Please find page 159 of the 2014 Hertz annual report below. You can navigate through the pages in the report by either clicking on the pages listed below, or by using the keyword search tool below to find specific information within the annual report.-
 1
1 -
2
-
3
-
4
-
5
-
6
-
7
-
8
-
9
-
10
-
11
-
12
-
13
-
14
-
15
-
16
-
17
-
18
-
19
-
20
-
21
-
22
-
23
-
24
-
25
-
26
-
27
-
28
-
29
-
30
-
31
-
32
-
33
-
34
-
35
-
36
-
37
-
38
-
39
-
40
-
41
-
42
-
43
-
44
-
45
-
46
-
47
-
48
-
49
-
50
-
51
-
52
-
53
-
54
-
55
-
56
-
57
-
58
-
59
-
60
-
61
-
62
-
63
-
64
-
65
-
66
-
67
-
68
-
69
-
70
-
71
-
72
-
73
-
74
-
75
-
76
-
77
-
78
-
79
-
80
-
81
-
82
-
83
-
84
-
85
-
86
-
87
-
88
-
89
-
90
-
91
-
92
-
93
-
94
-
95
-
96
-
97
-
98
-
99
-
100
-
101
-
102
-
103
-
104
-
105
-
106
-
107
-
108
-
109
-
110
-
111
-
112
-
113
-
114
-
115
-
116
-
117
-
118
-
119
-
120
-
121
-
122
-
123
-
124
-
125
-
126
-
127
-
128
-
129
-
130
-
131
-
132
-
133
-
134
-
135
-
136
-
137
-
138
-
139
-
140
-
141
-
142
-
143
-
144
-
145
-
146
-
147
-
148
-
 149
149 -
 150
150 -
 151
151 -
 152
152 -
 153
153 -
 154
154 -
 155
155 -
 156
156 -
 157
157 -
 158
158 -
 159
159 -
 160
160 -
 161
161 -
 162
162 -
 163
163 -
 164
164 -
 165
165 -
 166
166 -
 167
167 -
 168
168 -
 169
169 -
170
-
171
-
172
-
173
-
174
-
175
-
176
-
177
-
178
-
179
-
180
-
181
-
182
-
183
-
184
-
185
-
186
-
187
-
188
-
189
-
190
-
191
-
192
-
193
-
194
-
195
-
196
-
197
-
198
-
199
-
200
-
201
-
202
-
203
-
204
-
205
-
206
-
207
-
208
-
209
-
210
-
211
-
212
-
213
-
214
-
215
-
216
-
217
-
218
-
219
-
220
-
221
-
222
-
223
-
224
-
225
-
226
-
227
-
228
-
229
-
230
-
231
-
232
-
233
-
234
-
235
-
236
-
237
-
238
-
239
-
240
-
241
-
242
-
243
-
244
-
245
-
246
-
247
-
248
-
249
-
250
-
251
-
252
-
253
-
254
-
255
-
256
-
257
-
258
-
259
-
260
-
261
-
262
-
263
-
264
-
265
-
266
-
267
-
268
-
269
-
270
-
271
-
272
-
273
-
274
-
275
-
276
-
277
-
278
-
279
-
280
-
281
-
282
-
283
-
284
-
285
-
286
-
287
-
288
-
289
-
290
-
291
-
292
-
293
-
294
-
295
-
296
-
297
-
298
-
299
-
300
-
301
-
302
-
303
-
304
-
305
-
306
-
307
-
308
-
309
-
310
-
311
-
312
-
313
-
314
-
315
-
316
-
317
-
318
-
319
-
320
-
321
-
322
-
323
-
324
-
325
-
326
-
327
-
328
-
329
-
330
-
331
-
332
-
333
-
334
-
335
-
336
-
337
-
338
-
339
-
340
-
341
-
342
-
343
-
344
-
345
-
346
-
347
-
348
-
349
-
350
-
351
-
352
-
353
-
354
-
355
-
356
-
357
-
358
-
359
-
360
-
361
-
362
-
363
-
364
-
365
-
366
-
367
-
368
-
369
-
370
-
371
-
372
-
373
-
374
-
375
-
376
-
377
-
378
-
379
-
380
-
381
-
382
-
383
-
384
-
385
-
386
 |
 |

Table of Contents
2014 Corporate EBITDA Margin exceeding a minimum level. "Corporate EBITDA Margin" means Corporate EBITDA as a percentage of
Consolidated Revenue. These PSU awards vest evenly over a three year vesting period.
In November 2014, the Company granted 137,000 Performance Stock Units at a grant date fair value of $22.01 per share and 500,000 stock
options to certain executives under the Omnibus Plan. The PSUs and stock options vest based on certain performance conditions deemed
probable of achievement as of the grant date.
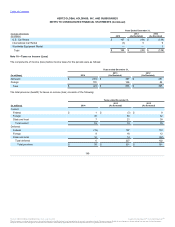
The Company operates an Employee Stock Purchase Plan for certain eligible employees and recognized compensation cost for the amount of the
discount on the stock purchased by its employees under the ESPP of $1 million in each of the years ended December 31, 2013 and 2012. The
plan was suspended in 2014 due to the Company's non-timely SEC filing status.
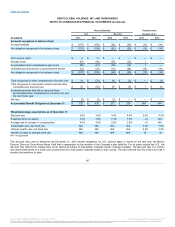
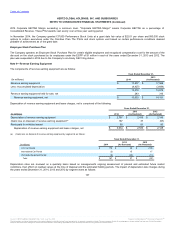
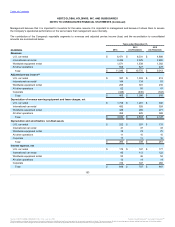
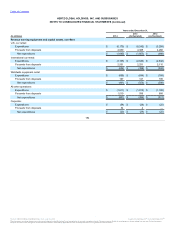
The components of revenue earning equipment are as follows:
(In millions)
Revenue earning equipment $ 17,837
$ 17,569
Less: Accumulated depreciation (4,427)
(3,694)
13,410
13,875
Revenue earning equipment held for sale, net 243
316
Revenue earning equipment, net $ 13,653
$ 14,191
Depreciation of revenue earning equipment and lease charges, net is comprised of the following:
Depreciation of revenue earning equipment $ 2,787
$ 2,415
$ 2,145
(Gain) loss on disposal of revenue earning equipment(a) 167
37
(97)
Rents paid for vehicles leased 80
81
80
Depreciation of revenue earning equipment and lease charges, net $ 3,034
$ 2,533
$ 2,128
(a) (Gain) loss on disposal of revenue earning equipment by segment is as follows:
(In millions)
U.S. Car Rental $ 178
$ 48
$ (101)
International Car Rental (2)
15
17
Worldwide Equipment Rental (9)
(26)
(13)
Total $ 167
$ 37
$ (97)
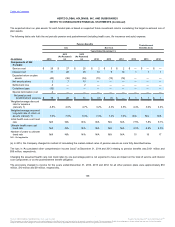
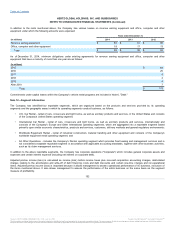
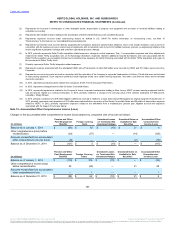
Depreciation rates are reviewed on a quarterly basis based on management's ongoing assessment of present and estimated future market
conditions, their effect on residual values at the time of disposal and the estimated holding periods. The impact of depreciation rate changes during
the years ended December 31, 2014, 2013 and 2012 by segment were as follows:
147
Source: HERTZ GLOBAL HOLDINGS INC, 10-K, July 16, 2015 Powered by Morningstar® Document Research℠
The information contained herein may not be copied, adapted or distributed and is not warranted to be accurate, complete or timely. The user assumes all risks for any damages or losses arising from any use of this information,
except to the extent such damages or losses cannot be limited or excluded by applicable law. Past financial performance is no guarantee of future results.