Hertz 2014 Annual Report Download - page 77
Download and view the complete annual report
Please find page 77 of the 2014 Hertz annual report below. You can navigate through the pages in the report by either clicking on the pages listed below, or by using the keyword search tool below to find specific information within the annual report.-
 1
1 -
2
-
3
-
4
-
5
-
6
-
7
-
8
-
9
-
10
-
11
-
12
-
13
-
14
-
15
-
16
-
17
-
18
-
19
-
20
-
21
-
22
-
23
-
24
-
25
-
26
-
27
-
28
-
29
-
30
-
31
-
32
-
33
-
34
-
35
-
36
-
37
-
38
-
39
-
40
-
41
-
42
-
43
-
44
-
45
-
46
-
47
-
48
-
49
-
50
-
51
-
52
-
53
-
54
-
55
-
56
-
57
-
58
-
59
-
60
-
61
-
62
-
63
-
64
-
65
-
66
-
 67
67 -
 68
68 -
 69
69 -
 70
70 -
 71
71 -
 72
72 -
 73
73 -
 74
74 -
 75
75 -
 76
76 -
 77
77 -
 78
78 -
 79
79 -
 80
80 -
 81
81 -
 82
82 -
 83
83 -
 84
84 -
 85
85 -
 86
86 -
 87
87 -
88
-
89
-
90
-
91
-
92
-
93
-
94
-
95
-
96
-
97
-
98
-
99
-
100
-
101
-
102
-
103
-
104
-
105
-
106
-
107
-
108
-
109
-
110
-
111
-
112
-
113
-
114
-
115
-
116
-
117
-
118
-
119
-
120
-
121
-
122
-
123
-
124
-
125
-
126
-
127
-
128
-
129
-
130
-
131
-
132
-
133
-
134
-
135
-
136
-
137
-
138
-
139
-
140
-
141
-
142
-
143
-
144
-
145
-
146
-
147
-
148
-
149
-
150
-
151
-
152
-
153
-
154
-
155
-
156
-
157
-
158
-
159
-
160
-
161
-
162
-
163
-
164
-
165
-
166
-
167
-
168
-
169
-
170
-
171
-
172
-
173
-
174
-
175
-
176
-
177
-
178
-
179
-
180
-
181
-
182
-
183
-
184
-
185
-
186
-
187
-
188
-
189
-
190
-
191
-
192
-
193
-
194
-
195
-
196
-
197
-
198
-
199
-
200
-
201
-
202
-
203
-
204
-
205
-
206
-
207
-
208
-
209
-
210
-
211
-
212
-
213
-
214
-
215
-
216
-
217
-
218
-
219
-
220
-
221
-
222
-
223
-
224
-
225
-
226
-
227
-
228
-
229
-
230
-
231
-
232
-
233
-
234
-
235
-
236
-
237
-
238
-
239
-
240
-
241
-
242
-
243
-
244
-
245
-
246
-
247
-
248
-
249
-
250
-
251
-
252
-
253
-
254
-
255
-
256
-
257
-
258
-
259
-
260
-
261
-
262
-
263
-
264
-
265
-
266
-
267
-
268
-
269
-
270
-
271
-
272
-
273
-
274
-
275
-
276
-
277
-
278
-
279
-
280
-
281
-
282
-
283
-
284
-
285
-
286
-
287
-
288
-
289
-
290
-
291
-
292
-
293
-
294
-
295
-
296
-
297
-
298
-
299
-
300
-
301
-
302
-
303
-
304
-
305
-
306
-
307
-
308
-
309
-
310
-
311
-
312
-
313
-
314
-
315
-
316
-
317
-
318
-
319
-
320
-
321
-
322
-
323
-
324
-
325
-
326
-
327
-
328
-
329
-
330
-
331
-
332
-
333
-
334
-
335
-
336
-
337
-
338
-
339
-
340
-
341
-
342
-
343
-
344
-
345
-
346
-
347
-
348
-
349
-
350
-
351
-
352
-
353
-
354
-
355
-
356
-
357
-
358
-
359
-
360
-
361
-
362
-
363
-
364
-
365
-
366
-
367
-
368
-
369
-
370
-
371
-
372
-
373
-
374
-
375
-
376
-
377
-
378
-
379
-
380
-
381
-
382
-
383
-
384
-
385
-
386
 |
 |

Table of Contents
country compared with first quarter 2013. Additionally, there was a $23 million increase in field administration and restructuring costs due
in part to the continued integration of Dollar Thrifty.
• For the International Car Rental segment, increases were the result of $11 million in incremental charges for PLPD insurance primarily
resulting from an unfavorable insurance claim during the first quarter of 2014. Additionally, there were increased commission costs due to
the shift in business mix, higher bad debt provisions for damage related receivables and increased toll expenses in Australia with the
addition of a new ancillary product.
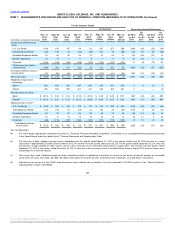
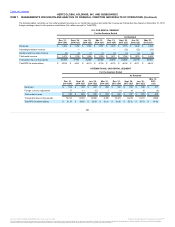
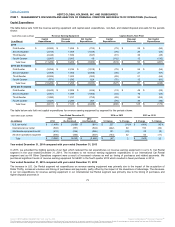
Depreciation of revenue earning equipment and
lease charges, net rose $212 million, or 33%, due mainly to an increase of $196 million in our U.S. Car Rental segment driven by higher per
vehicle depreciation rates. Net depreciation per unit per month for our U.S. Car Rental segment increased 59% to $365 from $229 quarter over
quarter. This increase was primarily due to declining residual values and a reduction in the planned hold period as we implemented our new fleet
strategy. Additionally, fourth quarter 2013 included $8 million of Dollar Thrifty acquisition accounting adjustments to reduce this expense.
Increases in the Worldwide Equipment Rental segment and our Donlen operations were due to their larger fleets. The increases were slightly offset
by declines in the International Car Rental segment driven by improved residual values, fleet mix and improved purchasing.
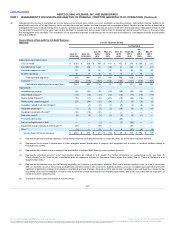
Depreciation of revenue earning equipment
and lease charges, net rose $74 million, or 11%, due mainly to an increase of $72 million in our U.S. Car Rental segment driven by higher per
vehicle depreciation rates. Net depreciation per unit per month for our U.S. Car Rental segment increased 22% to $265 from $217 quarter over
quarter. This increase was primarily due to declining residual values. Additionally, third quarter 2013 included $17 million of Dollar Thrifty
acquisition accounting adjustments to reduce this expense. Increases in the Worldwide Equipment Rental segment and our Donlen operations
were due to their larger fleets. The increases were slightly offset by declines in the International Car Rental segment driven by improved residual
values, fleet mix and improved purchasing.
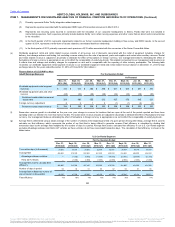
Depreciation of revenue earning equipment and lease
charges, net rose $76 million, or 12%, due mainly to an increase of $68 million in our U.S. Car Rental segment driven by higher per vehicle
depreciation rates. Net depreciation per unit per month for our U.S. Car Rental segment increased 20% to $259 from $216 quarter over quarter.
This increase was primarily due to declining residual values. Additionally, second quarter 2013 included $25 million of Dollar Thrifty acquisition
accounting adjustments to reduce this expense. Increases in the Worldwide Equipment Rental segment and our Donlen operations were due to
their larger fleets. The increases were slightly offset by declines in the International Car Rental segment driven by improved residual values, fleet
mix and improved purchasing.
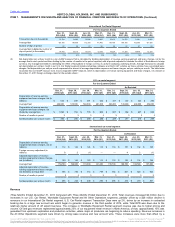
Depreciation of revenue earning equipment and lease
charges, net rose $137 million, or 23%, due mainly to an increase of $139 million in our U.S. Car Rental segment driven by higher per vehicle
depreciation rates. Net depreciation per unit per month for our U.S. Car Rental segment increased 38% to $288 from $209 quarter over quarter.
This increase was primarily due to declining residual values. Additionally, first quarter 2013 included $30 million of Dollar Thrifty acquisition
accounting adjustments to reduce this expense. Declines in the International Car Rental segment of $11 million driven by improved residual
values, fleet mix and improved purchasing were mostly offset by increases in the Worldwide Equipment Rental segment and our Donlen operations
due to their larger fleets.
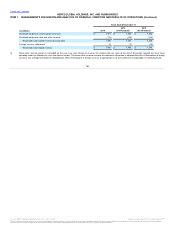
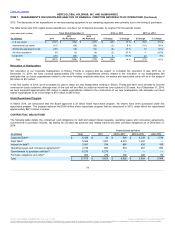
SG&A increased $11 million, or 5%, due
mainly to costs associated with the previously disclosed accounting review and restatement and the anticipated HERC spin-off transaction.
65
Source: HERTZ GLOBAL HOLDINGS INC, 10-K, July 16, 2015 Powered by Morningstar® Document Research℠
The information contained herein may not be copied, adapted or distributed and is not warranted to be accurate, complete or timely. The user assumes all risks for any damages or losses arising from any use of this information,
except to the extent such damages or losses cannot be limited or excluded by applicable law. Past financial performance is no guarantee of future results.