Hertz 2014 Annual Report Download - page 118
Download and view the complete annual report
Please find page 118 of the 2014 Hertz annual report below. You can navigate through the pages in the report by either clicking on the pages listed below, or by using the keyword search tool below to find specific information within the annual report.-
 1
1 -
2
-
3
-
4
-
5
-
6
-
7
-
8
-
9
-
10
-
11
-
12
-
13
-
14
-
15
-
16
-
17
-
18
-
19
-
20
-
21
-
22
-
23
-
24
-
25
-
26
-
27
-
28
-
29
-
30
-
31
-
32
-
33
-
34
-
35
-
36
-
37
-
38
-
39
-
40
-
41
-
42
-
43
-
44
-
45
-
46
-
47
-
48
-
49
-
50
-
51
-
52
-
53
-
54
-
55
-
56
-
57
-
58
-
59
-
60
-
61
-
62
-
63
-
64
-
65
-
66
-
67
-
68
-
69
-
70
-
71
-
72
-
73
-
74
-
75
-
76
-
77
-
78
-
79
-
80
-
81
-
82
-
83
-
84
-
85
-
86
-
87
-
88
-
89
-
90
-
91
-
92
-
93
-
94
-
95
-
96
-
97
-
98
-
99
-
100
-
101
-
102
-
103
-
104
-
105
-
106
-
107
-
 108
108 -
 109
109 -
 110
110 -
 111
111 -
 112
112 -
 113
113 -
 114
114 -
 115
115 -
 116
116 -
 117
117 -
 118
118 -
 119
119 -
 120
120 -
 121
121 -
 122
122 -
 123
123 -
 124
124 -
 125
125 -
 126
126 -
 127
127 -
 128
128 -
129
-
130
-
131
-
132
-
133
-
134
-
135
-
136
-
137
-
138
-
139
-
140
-
141
-
142
-
143
-
144
-
145
-
146
-
147
-
148
-
149
-
150
-
151
-
152
-
153
-
154
-
155
-
156
-
157
-
158
-
159
-
160
-
161
-
162
-
163
-
164
-
165
-
166
-
167
-
168
-
169
-
170
-
171
-
172
-
173
-
174
-
175
-
176
-
177
-
178
-
179
-
180
-
181
-
182
-
183
-
184
-
185
-
186
-
187
-
188
-
189
-
190
-
191
-
192
-
193
-
194
-
195
-
196
-
197
-
198
-
199
-
200
-
201
-
202
-
203
-
204
-
205
-
206
-
207
-
208
-
209
-
210
-
211
-
212
-
213
-
214
-
215
-
216
-
217
-
218
-
219
-
220
-
221
-
222
-
223
-
224
-
225
-
226
-
227
-
228
-
229
-
230
-
231
-
232
-
233
-
234
-
235
-
236
-
237
-
238
-
239
-
240
-
241
-
242
-
243
-
244
-
245
-
246
-
247
-
248
-
249
-
250
-
251
-
252
-
253
-
254
-
255
-
256
-
257
-
258
-
259
-
260
-
261
-
262
-
263
-
264
-
265
-
266
-
267
-
268
-
269
-
270
-
271
-
272
-
273
-
274
-
275
-
276
-
277
-
278
-
279
-
280
-
281
-
282
-
283
-
284
-
285
-
286
-
287
-
288
-
289
-
290
-
291
-
292
-
293
-
294
-
295
-
296
-
297
-
298
-
299
-
300
-
301
-
302
-
303
-
304
-
305
-
306
-
307
-
308
-
309
-
310
-
311
-
312
-
313
-
314
-
315
-
316
-
317
-
318
-
319
-
320
-
321
-
322
-
323
-
324
-
325
-
326
-
327
-
328
-
329
-
330
-
331
-
332
-
333
-
334
-
335
-
336
-
337
-
338
-
339
-
340
-
341
-
342
-
343
-
344
-
345
-
346
-
347
-
348
-
349
-
350
-
351
-
352
-
353
-
354
-
355
-
356
-
357
-
358
-
359
-
360
-
361
-
362
-
363
-
364
-
365
-
366
-
367
-
368
-
369
-
370
-
371
-
372
-
373
-
374
-
375
-
376
-
377
-
378
-
379
-
380
-
381
-
382
-
383
-
384
-
385
-
386
 |
 |

Table of Contents
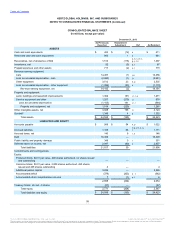
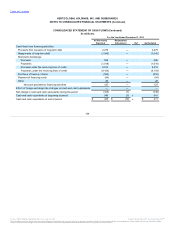
Cash flows from financing activities:
Proceeds from issuance of long-term debt 2,237
—
2,237
Repayments of long-term debt (952)
—
(952)
Short-term borrowings:
Proceeds 438
—
438
Payments (1,280)
—
(1,280)
Proceeds under the revolving lines of credit 6,464
—
6,464
Payments under the revolving lines of credit (5,190)
—
(5,190)
Purchase of noncontrolling interest (38)
—
(38)
Payment of financing costs (49)
—
(49)
Other (5)
(1)
(6)
Net cash provided by financing activities 1,625
(1)
1,624
Effect of foreign exchange rate changes on cash and cash
equivalents 6
—
6
Net change in cash and cash equivalents during the period (386)
8
(378)
Cash and cash equivalents at beginning of period 932
(13)
k
919
Cash and cash equivalents at end of period $ 546
$ (5)
k
$ 541
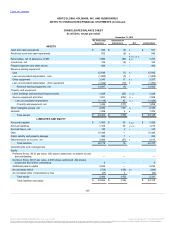
The Company’s consolidated financial statements have been prepared in accordance with accounting principles generally accepted in the United
States of America (“U.S. GAAP”).
In 2014, the Company changed its method of calculating the market-related value of pension assets for the U.S. Plan for purposes of determining
the expected return on plan assets and accounting for asset gains and losses. The new method uses fair value instead of the calculated market-
related value that has been used historically. The Company believes this method is preferable as it represents fair value as of the balance sheet
date. This change in accounting principle was applied retroactively to all prior periods. In connection with the change in accounting principle, the
Company determined that the calculated market-related value was not properly valued subsequent to the 2005 purchase accounting applied when
the Company was sold by Ford Motor Company to a consortium of private equity investors and therefore a portion of the cumulative impact on
expense due to the change in asset method has been deemed a correction of an error. The cumulative impact from 2005-2014 is an increase in
accumulated other comprehensive loss and a decrease in the accumulated deficit of $27 million ($17 million, net of tax), $24 million ($15 million,
net of tax) of which has been deemed to be due to the change in accounting principle, and $3 million ($2 million, net of tax) is attributable to the
correction of an error. See Note 7, "Employee Retirement Benefits" for more details on the impact of the change in accounting principle on the
Company's financial statements.
106
Source: HERTZ GLOBAL HOLDINGS INC, 10-K, July 16, 2015 Powered by Morningstar® Document Research℠
The information contained herein may not be copied, adapted or distributed and is not warranted to be accurate, complete or timely. The user assumes all risks for any damages or losses arising from any use of this information,
except to the extent such damages or losses cannot be limited or excluded by applicable law. Past financial performance is no guarantee of future results.