Hertz 2014 Annual Report Download - page 150
Download and view the complete annual report
Please find page 150 of the 2014 Hertz annual report below. You can navigate through the pages in the report by either clicking on the pages listed below, or by using the keyword search tool below to find specific information within the annual report.-
 1
1 -
2
-
3
-
4
-
5
-
6
-
7
-
8
-
9
-
10
-
11
-
12
-
13
-
14
-
15
-
16
-
17
-
18
-
19
-
20
-
21
-
22
-
23
-
24
-
25
-
26
-
27
-
28
-
29
-
30
-
31
-
32
-
33
-
34
-
35
-
36
-
37
-
38
-
39
-
40
-
41
-
42
-
43
-
44
-
45
-
46
-
47
-
48
-
49
-
50
-
51
-
52
-
53
-
54
-
55
-
56
-
57
-
58
-
59
-
60
-
61
-
62
-
63
-
64
-
65
-
66
-
67
-
68
-
69
-
70
-
71
-
72
-
73
-
74
-
75
-
76
-
77
-
78
-
79
-
80
-
81
-
82
-
83
-
84
-
85
-
86
-
87
-
88
-
89
-
90
-
91
-
92
-
93
-
94
-
95
-
96
-
97
-
98
-
99
-
100
-
101
-
102
-
103
-
104
-
105
-
106
-
107
-
108
-
109
-
110
-
111
-
112
-
113
-
114
-
115
-
116
-
117
-
118
-
119
-
120
-
121
-
122
-
123
-
124
-
125
-
126
-
127
-
128
-
129
-
130
-
131
-
132
-
133
-
134
-
135
-
136
-
137
-
138
-
139
-
 140
140 -
 141
141 -
 142
142 -
 143
143 -
 144
144 -
 145
145 -
 146
146 -
 147
147 -
 148
148 -
 149
149 -
 150
150 -
 151
151 -
 152
152 -
 153
153 -
 154
154 -
 155
155 -
 156
156 -
 157
157 -
 158
158 -
 159
159 -
 160
160 -
161
-
162
-
163
-
164
-
165
-
166
-
167
-
168
-
169
-
170
-
171
-
172
-
173
-
174
-
175
-
176
-
177
-
178
-
179
-
180
-
181
-
182
-
183
-
184
-
185
-
186
-
187
-
188
-
189
-
190
-
191
-
192
-
193
-
194
-
195
-
196
-
197
-
198
-
199
-
200
-
201
-
202
-
203
-
204
-
205
-
206
-
207
-
208
-
209
-
210
-
211
-
212
-
213
-
214
-
215
-
216
-
217
-
218
-
219
-
220
-
221
-
222
-
223
-
224
-
225
-
226
-
227
-
228
-
229
-
230
-
231
-
232
-
233
-
234
-
235
-
236
-
237
-
238
-
239
-
240
-
241
-
242
-
243
-
244
-
245
-
246
-
247
-
248
-
249
-
250
-
251
-
252
-
253
-
254
-
255
-
256
-
257
-
258
-
259
-
260
-
261
-
262
-
263
-
264
-
265
-
266
-
267
-
268
-
269
-
270
-
271
-
272
-
273
-
274
-
275
-
276
-
277
-
278
-
279
-
280
-
281
-
282
-
283
-
284
-
285
-
286
-
287
-
288
-
289
-
290
-
291
-
292
-
293
-
294
-
295
-
296
-
297
-
298
-
299
-
300
-
301
-
302
-
303
-
304
-
305
-
306
-
307
-
308
-
309
-
310
-
311
-
312
-
313
-
314
-
315
-
316
-
317
-
318
-
319
-
320
-
321
-
322
-
323
-
324
-
325
-
326
-
327
-
328
-
329
-
330
-
331
-
332
-
333
-
334
-
335
-
336
-
337
-
338
-
339
-
340
-
341
-
342
-
343
-
344
-
345
-
346
-
347
-
348
-
349
-
350
-
351
-
352
-
353
-
354
-
355
-
356
-
357
-
358
-
359
-
360
-
361
-
362
-
363
-
364
-
365
-
366
-
367
-
368
-
369
-
370
-
371
-
372
-
373
-
374
-
375
-
376
-
377
-
378
-
379
-
380
-
381
-
382
-
383
-
384
-
385
-
386
 |
 |

Table of Contents
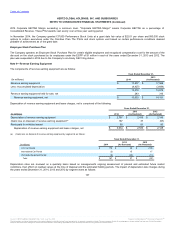
The expected return on plan assets for each funded plan is based on expected future investment returns considering the target investment mix of
plan assets.
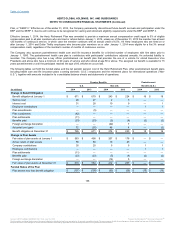
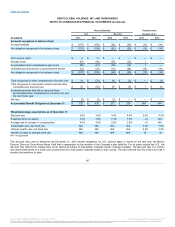
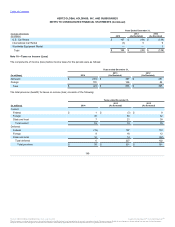
The following table sets forth the net periodic pension and postretirement (including health care, life insurance and auto) expense:
Service cost $ 28
$ 27
$ 25
$ 2
$ 3
$ 2
$ —
$ —
$ —
Interest cost 31
28
28
10
9
10
1
1
1
Expected return on plan
assets (40)
(36)
(34)
(15)
(13)
(12)
—
—
—
Net amortizations 2
7
10
—
—
—
—
—
—
Settlement loss 4
—
2
—
—
—
—
—
—
Curtailment gain (10)
—
—
—
—
—
—
—
—
Special termination cost 4
—
—
—
—
—
—
—
—
Net pension and
postretirement expense $ 19
$ 26
$ 31
$ (3)
$ (1)
$ —
$ 1
$ 1
$ 1
Weighted-average discount
rate for expense
(January 1) 4.8%
4.0%
4.7%
3.2%
4.3%
4.8%
4.4%
3.6%
4.4%
Weighted-average assumed
long-term rate of return on
assets (January 1) 7.6%
7.6%
8.0%
7.4%
7.4%
7.4%
N/A
N/A
N/A
Initial health care cost trend
rate N/A
N/A
N/A
N/A
N/A
N/A
7.5%
7.8%
8.1%
Ultimate health care cost
trend rate N/A
N/A
N/A
N/A
N/A
N/A
4.5%
4.5%
4.5%
Number of years to ultimate
trend rate N/A
N/A
N/A
N/A
N/A
N/A
15
16
17
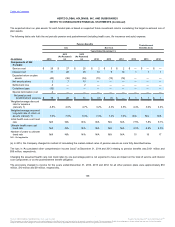
(a) In 2014, the Company changed its method of calculating the market-related value of pension assets as more fully described below.
The loss in “Accumulated other comprehensive income (loss)” at December 31, 2014 and 2013 relating to pension benefits was $101 million and
$58 million, respectively.
Changing the assumed health care cost trend rates by one percentage point is not expected to have an impact on the total of service and interest
cost components or on the postretirement benefit obligation.
The provisions charged to income for the years ended December 31, 2014, 2013 and 2012 for all other pension plans were approximately $10
million, $10 million and $9 million, respectively.
138
Source: HERTZ GLOBAL HOLDINGS INC, 10-K, July 16, 2015 Powered by Morningstar® Document Research℠
The information contained herein may not be copied, adapted or distributed and is not warranted to be accurate, complete or timely. The user assumes all risks for any damages or losses arising from any use of this information,
except to the extent such damages or losses cannot be limited or excluded by applicable law. Past financial performance is no guarantee of future results.