Hertz 2014 Annual Report Download - page 161
Download and view the complete annual report
Please find page 161 of the 2014 Hertz annual report below. You can navigate through the pages in the report by either clicking on the pages listed below, or by using the keyword search tool below to find specific information within the annual report.-
 1
1 -
2
-
3
-
4
-
5
-
6
-
7
-
8
-
9
-
10
-
11
-
12
-
13
-
14
-
15
-
16
-
17
-
18
-
19
-
20
-
21
-
22
-
23
-
24
-
25
-
26
-
27
-
28
-
29
-
30
-
31
-
32
-
33
-
34
-
35
-
36
-
37
-
38
-
39
-
40
-
41
-
42
-
43
-
44
-
45
-
46
-
47
-
48
-
49
-
50
-
51
-
52
-
53
-
54
-
55
-
56
-
57
-
58
-
59
-
60
-
61
-
62
-
63
-
64
-
65
-
66
-
67
-
68
-
69
-
70
-
71
-
72
-
73
-
74
-
75
-
76
-
77
-
78
-
79
-
80
-
81
-
82
-
83
-
84
-
85
-
86
-
87
-
88
-
89
-
90
-
91
-
92
-
93
-
94
-
95
-
96
-
97
-
98
-
99
-
100
-
101
-
102
-
103
-
104
-
105
-
106
-
107
-
108
-
109
-
110
-
111
-
112
-
113
-
114
-
115
-
116
-
117
-
118
-
119
-
120
-
121
-
122
-
123
-
124
-
125
-
126
-
127
-
128
-
129
-
130
-
131
-
132
-
133
-
134
-
135
-
136
-
137
-
138
-
139
-
140
-
141
-
142
-
143
-
144
-
145
-
146
-
147
-
148
-
149
-
150
-
 151
151 -
 152
152 -
 153
153 -
 154
154 -
 155
155 -
 156
156 -
 157
157 -
 158
158 -
 159
159 -
 160
160 -
 161
161 -
 162
162 -
 163
163 -
 164
164 -
 165
165 -
 166
166 -
 167
167 -
 168
168 -
 169
169 -
 170
170 -
 171
171 -
172
-
173
-
174
-
175
-
176
-
177
-
178
-
179
-
180
-
181
-
182
-
183
-
184
-
185
-
186
-
187
-
188
-
189
-
190
-
191
-
192
-
193
-
194
-
195
-
196
-
197
-
198
-
199
-
200
-
201
-
202
-
203
-
204
-
205
-
206
-
207
-
208
-
209
-
210
-
211
-
212
-
213
-
214
-
215
-
216
-
217
-
218
-
219
-
220
-
221
-
222
-
223
-
224
-
225
-
226
-
227
-
228
-
229
-
230
-
231
-
232
-
233
-
234
-
235
-
236
-
237
-
238
-
239
-
240
-
241
-
242
-
243
-
244
-
245
-
246
-
247
-
248
-
249
-
250
-
251
-
252
-
253
-
254
-
255
-
256
-
257
-
258
-
259
-
260
-
261
-
262
-
263
-
264
-
265
-
266
-
267
-
268
-
269
-
270
-
271
-
272
-
273
-
274
-
275
-
276
-
277
-
278
-
279
-
280
-
281
-
282
-
283
-
284
-
285
-
286
-
287
-
288
-
289
-
290
-
291
-
292
-
293
-
294
-
295
-
296
-
297
-
298
-
299
-
300
-
301
-
302
-
303
-
304
-
305
-
306
-
307
-
308
-
309
-
310
-
311
-
312
-
313
-
314
-
315
-
316
-
317
-
318
-
319
-
320
-
321
-
322
-
323
-
324
-
325
-
326
-
327
-
328
-
329
-
330
-
331
-
332
-
333
-
334
-
335
-
336
-
337
-
338
-
339
-
340
-
341
-
342
-
343
-
344
-
345
-
346
-
347
-
348
-
349
-
350
-
351
-
352
-
353
-
354
-
355
-
356
-
357
-
358
-
359
-
360
-
361
-
362
-
363
-
364
-
365
-
366
-
367
-
368
-
369
-
370
-
371
-
372
-
373
-
374
-
375
-
376
-
377
-
378
-
379
-
380
-
381
-
382
-
383
-
384
-
385
-
386
 |
 |

Table of Contents
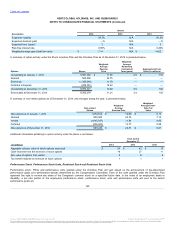
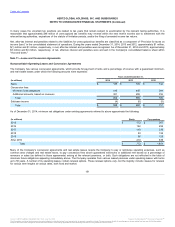
The principal items of the U.S. and foreign net deferred tax assets and liabilities at December 31, 2014 and 2013 are as follows:
Deferred Tax Assets:
Employee benefit plans
$ 82
$ 84
Net operating loss carryforwards
1,936
1,929
Federal, state and foreign local tax credit carryforwards
26
27
Accrued and prepaid expenses
263
268
Total Deferred Tax Assets
2,307
2,308
Less: Valuation Allowance
(231)
(273)
Total Net Deferred Tax Assets
2,076
2,035
Deferred Tax Liabilities:
Depreciation on tangible assets
(3,489)
(3,428)
Intangible assets
(1,415)
(1,436)
Total Deferred Tax Liabilities
(4,904)
(4,864)
Net Deferred Tax Liability
$ (2,828)
$ (2,829)
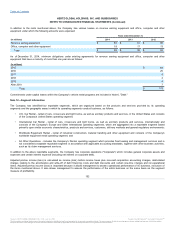
As of December 31, 2014, deferred tax assets of $1,587 million were recorded for unutilized U.S. Federal Net Operating Losses, or “NOL,” carry
forwards of $4,534 million. The total Federal NOL carry forwards are $4,669 million of which $135 million relate to excess tax deductions
associated with stock compensation plans which have yet to reduce taxes payable. Upon the utilization of these carry forwards, the associated
tax benefits of approximately $47 million will be recorded to Additional paid-in capital. The Federal NOLs begin to expire in 2028. State NOLs
exclusive of the effects of the excess tax deductions, have generated a deferred tax asset of $166 million. As of December 31, 2014, a valuation
allowance of $16 million was recorded against these deferred tax assets because they relate to separate states that have historical losses where it
is more likely than not that the NOL carry forwards may not be utilized in the future. The state NOLs expire over various years beginning in 2015
depending upon when they were generated and the particular jurisdiction.
As of December 31, 2014, deferred tax assets of $166 million were recorded for foreign NOL carry forwards of $804 million. A valuation allowance
of $148 million at December 31, 2014 was recorded against these deferred tax assets because those assets relate to jurisdictions that have
historical losses and it is more likely than not that a portion of the NOL carry forwards may not be utilized in the future.
The foreign NOL carry forwards of $804 million include $570 million which have an indefinite carry forward period and associated deferred tax
assets of $107 million. The remaining foreign NOLs of $234 million are subject to expiration beginning in 2015 and have associated deferred tax
assets of $59 million.
In determining the valuation allowance, an assessment of positive and negative evidence was performed regarding realization of the net deferred
tax assets in accordance with ASC 740-10, “Accounting for Income Taxes,” or “ASC 740-10.” This assessment included the evaluation of
scheduled reversals of deferred tax liabilities, the availability of carry forwards and estimates of projected future taxable income. Based on the
assessment, as of December 31, 2014, total valuation allowances of $231 million were recorded against deferred tax assets. Although realization
is not assured, the Company has concluded that it is more likely than not the remaining deferred tax assets of $2,076 million will be realized and
as such no valuation allowance has been provided on these assets.
As of December 31, 2014, deferred tax assets of $26 million were recorded for Federal Alternative Minimum Tax Credits and various State Tax
Credits.
149
Source: HERTZ GLOBAL HOLDINGS INC, 10-K, July 16, 2015 Powered by Morningstar® Document Research℠
The information contained herein may not be copied, adapted or distributed and is not warranted to be accurate, complete or timely. The user assumes all risks for any damages or losses arising from any use of this information,
except to the extent such damages or losses cannot be limited or excluded by applicable law. Past financial performance is no guarantee of future results.