Hertz 2014 Annual Report Download - page 151
Download and view the complete annual report
Please find page 151 of the 2014 Hertz annual report below. You can navigate through the pages in the report by either clicking on the pages listed below, or by using the keyword search tool below to find specific information within the annual report.-
 1
1 -
2
-
3
-
4
-
5
-
6
-
7
-
8
-
9
-
10
-
11
-
12
-
13
-
14
-
15
-
16
-
17
-
18
-
19
-
20
-
21
-
22
-
23
-
24
-
25
-
26
-
27
-
28
-
29
-
30
-
31
-
32
-
33
-
34
-
35
-
36
-
37
-
38
-
39
-
40
-
41
-
42
-
43
-
44
-
45
-
46
-
47
-
48
-
49
-
50
-
51
-
52
-
53
-
54
-
55
-
56
-
57
-
58
-
59
-
60
-
61
-
62
-
63
-
64
-
65
-
66
-
67
-
68
-
69
-
70
-
71
-
72
-
73
-
74
-
75
-
76
-
77
-
78
-
79
-
80
-
81
-
82
-
83
-
84
-
85
-
86
-
87
-
88
-
89
-
90
-
91
-
92
-
93
-
94
-
95
-
96
-
97
-
98
-
99
-
100
-
101
-
102
-
103
-
104
-
105
-
106
-
107
-
108
-
109
-
110
-
111
-
112
-
113
-
114
-
115
-
116
-
117
-
118
-
119
-
120
-
121
-
122
-
123
-
124
-
125
-
126
-
127
-
128
-
129
-
130
-
131
-
132
-
133
-
134
-
135
-
136
-
137
-
138
-
139
-
140
-
 141
141 -
 142
142 -
 143
143 -
 144
144 -
 145
145 -
 146
146 -
 147
147 -
 148
148 -
 149
149 -
 150
150 -
 151
151 -
 152
152 -
 153
153 -
 154
154 -
 155
155 -
 156
156 -
 157
157 -
 158
158 -
 159
159 -
 160
160 -
 161
161 -
162
-
163
-
164
-
165
-
166
-
167
-
168
-
169
-
170
-
171
-
172
-
173
-
174
-
175
-
176
-
177
-
178
-
179
-
180
-
181
-
182
-
183
-
184
-
185
-
186
-
187
-
188
-
189
-
190
-
191
-
192
-
193
-
194
-
195
-
196
-
197
-
198
-
199
-
200
-
201
-
202
-
203
-
204
-
205
-
206
-
207
-
208
-
209
-
210
-
211
-
212
-
213
-
214
-
215
-
216
-
217
-
218
-
219
-
220
-
221
-
222
-
223
-
224
-
225
-
226
-
227
-
228
-
229
-
230
-
231
-
232
-
233
-
234
-
235
-
236
-
237
-
238
-
239
-
240
-
241
-
242
-
243
-
244
-
245
-
246
-
247
-
248
-
249
-
250
-
251
-
252
-
253
-
254
-
255
-
256
-
257
-
258
-
259
-
260
-
261
-
262
-
263
-
264
-
265
-
266
-
267
-
268
-
269
-
270
-
271
-
272
-
273
-
274
-
275
-
276
-
277
-
278
-
279
-
280
-
281
-
282
-
283
-
284
-
285
-
286
-
287
-
288
-
289
-
290
-
291
-
292
-
293
-
294
-
295
-
296
-
297
-
298
-
299
-
300
-
301
-
302
-
303
-
304
-
305
-
306
-
307
-
308
-
309
-
310
-
311
-
312
-
313
-
314
-
315
-
316
-
317
-
318
-
319
-
320
-
321
-
322
-
323
-
324
-
325
-
326
-
327
-
328
-
329
-
330
-
331
-
332
-
333
-
334
-
335
-
336
-
337
-
338
-
339
-
340
-
341
-
342
-
343
-
344
-
345
-
346
-
347
-
348
-
349
-
350
-
351
-
352
-
353
-
354
-
355
-
356
-
357
-
358
-
359
-
360
-
361
-
362
-
363
-
364
-
365
-
366
-
367
-
368
-
369
-
370
-
371
-
372
-
373
-
374
-
375
-
376
-
377
-
378
-
379
-
380
-
381
-
382
-
383
-
384
-
385
-
386
 |
 |

Table of Contents
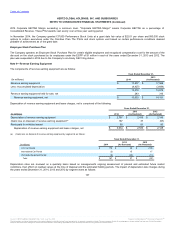
The provisions charged to income for the years ended December 31, 2014, 2013 and 2012 for the defined contribution plans were approximately
$18 million, $18 million and $19 million, respectively.
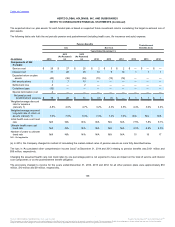
The Company has a long-term investment outlook for the assets held in the Company sponsored plans, which is consistent with the long-term
nature of each plan's respective liabilities. The Company has two major plans which reside in the U.S. and the U.K.
The U.S. Plan, or the “Plan,” currently has a target asset allocation of 65% equity and 35% fixed income. The equity portion of the Plan is invested
in one passively managed S&P 500 index fund, one passively managed U.S. small/midcap fund, one actively managed international fund and one
actively managed emerging markets fund. The fixed income portion of the Plan is actively managed by professional investment managers and is
benchmarked to the Barclays Long Govt/Credit Index. The Plan assumes a 7.4% rate of return on assets expected long-term annual weighted-
average for the Plan in total.
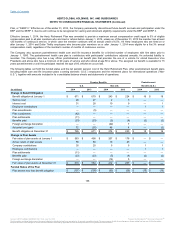
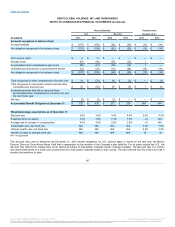
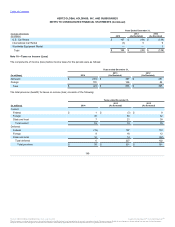
In 2014, the Company changed its method of calculating the market-related value of pension assets for the U.S. Plan for purposes of determining
the expected return on plan assets and accounting for asset gains and losses. The new method uses fair value instead of the calculated market-
related value that has been used historically. The Company believes this method is preferable as it represents fair value as of the balance sheet
date. This change in accounting principle was applied retroactively to all prior periods. In connection with the change in accounting principle, the
Company determined that the calculated market-related value was not properly valued subsequent to the 2005 acquisition accounting applied when
the Company was sold by Ford Motor Company to a consortium of private equity investors and therefore a portion of the cumulative impact on
expense due to the change in asset method has been deemed a correction of an error .The cumulative impact from 2005-2014 is an increase in
accumulated other comprehensive loss and a decrease in the accumulated deficit of $27 million ($17 million, net of tax), $24 million ($15 million,
net of tax) of which has been deemed to be due to the change in accounting principle, and $3 million ($2 million, net of tax) is attributable to the
correction of an error. The impact of the change in accounting principle was a $4 million increase to accumulated deficit and a corresponding
reduction in accumulated other comprehensive loss as of January 1, 2012 (net of tax), while the impact of the error correction was a $2 million
decrease to accumulated deficit and increase to accumulated other comprehensive loss as of January 1, 2012 (net of tax). The error correction
was immaterial to each of the annual periods presented in this Annual Report on Form 10-K. The following table sets forth the effect of the change
in accounting principle by period.
139
Source: HERTZ GLOBAL HOLDINGS INC, 10-K, July 16, 2015 Powered by Morningstar® Document Research℠
The information contained herein may not be copied, adapted or distributed and is not warranted to be accurate, complete or timely. The user assumes all risks for any damages or losses arising from any use of this information,
except to the extent such damages or losses cannot be limited or excluded by applicable law. Past financial performance is no guarantee of future results.