Hertz 2014 Annual Report Download - page 58
Download and view the complete annual report
Please find page 58 of the 2014 Hertz annual report below. You can navigate through the pages in the report by either clicking on the pages listed below, or by using the keyword search tool below to find specific information within the annual report.-
 1
1 -
2
-
3
-
4
-
5
-
6
-
7
-
8
-
9
-
10
-
11
-
12
-
13
-
14
-
15
-
16
-
17
-
18
-
19
-
20
-
21
-
22
-
23
-
24
-
25
-
26
-
27
-
28
-
29
-
30
-
31
-
32
-
33
-
34
-
35
-
36
-
37
-
38
-
39
-
40
-
41
-
42
-
43
-
44
-
45
-
46
-
47
-
 48
48 -
 49
49 -
 50
50 -
 51
51 -
 52
52 -
 53
53 -
 54
54 -
 55
55 -
 56
56 -
 57
57 -
 58
58 -
 59
59 -
 60
60 -
 61
61 -
 62
62 -
 63
63 -
 64
64 -
 65
65 -
 66
66 -
 67
67 -
 68
68 -
69
-
70
-
71
-
72
-
73
-
74
-
75
-
76
-
77
-
78
-
79
-
80
-
81
-
82
-
83
-
84
-
85
-
86
-
87
-
88
-
89
-
90
-
91
-
92
-
93
-
94
-
95
-
96
-
97
-
98
-
99
-
100
-
101
-
102
-
103
-
104
-
105
-
106
-
107
-
108
-
109
-
110
-
111
-
112
-
113
-
114
-
115
-
116
-
117
-
118
-
119
-
120
-
121
-
122
-
123
-
124
-
125
-
126
-
127
-
128
-
129
-
130
-
131
-
132
-
133
-
134
-
135
-
136
-
137
-
138
-
139
-
140
-
141
-
142
-
143
-
144
-
145
-
146
-
147
-
148
-
149
-
150
-
151
-
152
-
153
-
154
-
155
-
156
-
157
-
158
-
159
-
160
-
161
-
162
-
163
-
164
-
165
-
166
-
167
-
168
-
169
-
170
-
171
-
172
-
173
-
174
-
175
-
176
-
177
-
178
-
179
-
180
-
181
-
182
-
183
-
184
-
185
-
186
-
187
-
188
-
189
-
190
-
191
-
192
-
193
-
194
-
195
-
196
-
197
-
198
-
199
-
200
-
201
-
202
-
203
-
204
-
205
-
206
-
207
-
208
-
209
-
210
-
211
-
212
-
213
-
214
-
215
-
216
-
217
-
218
-
219
-
220
-
221
-
222
-
223
-
224
-
225
-
226
-
227
-
228
-
229
-
230
-
231
-
232
-
233
-
234
-
235
-
236
-
237
-
238
-
239
-
240
-
241
-
242
-
243
-
244
-
245
-
246
-
247
-
248
-
249
-
250
-
251
-
252
-
253
-
254
-
255
-
256
-
257
-
258
-
259
-
260
-
261
-
262
-
263
-
264
-
265
-
266
-
267
-
268
-
269
-
270
-
271
-
272
-
273
-
274
-
275
-
276
-
277
-
278
-
279
-
280
-
281
-
282
-
283
-
284
-
285
-
286
-
287
-
288
-
289
-
290
-
291
-
292
-
293
-
294
-
295
-
296
-
297
-
298
-
299
-
300
-
301
-
302
-
303
-
304
-
305
-
306
-
307
-
308
-
309
-
310
-
311
-
312
-
313
-
314
-
315
-
316
-
317
-
318
-
319
-
320
-
321
-
322
-
323
-
324
-
325
-
326
-
327
-
328
-
329
-
330
-
331
-
332
-
333
-
334
-
335
-
336
-
337
-
338
-
339
-
340
-
341
-
342
-
343
-
344
-
345
-
346
-
347
-
348
-
349
-
350
-
351
-
352
-
353
-
354
-
355
-
356
-
357
-
358
-
359
-
360
-
361
-
362
-
363
-
364
-
365
-
366
-
367
-
368
-
369
-
370
-
371
-
372
-
373
-
374
-
375
-
376
-
377
-
378
-
379
-
380
-
381
-
382
-
383
-
384
-
385
-
386
 |
 |

Table of Contents
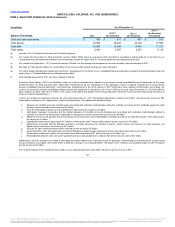
diversification, acceleration of our retail sales expansion and the optimization of fleet holding periods related to the integration of Dollar Thrifty. The
cumulative effect of the reduction in rates was also indicative of the residual values experienced in the U.S. for the years ended December 31,
2013 and 2012.
For the years ended December 31, 2014, 2013 and 2012, our U.S. car rental operations sold approximately 187,000, 206,000 and 153,000 non-
program cars. The 35% increase in 2013 versus 2012 was primarily related to our acquisition of Dollar Thrifty.
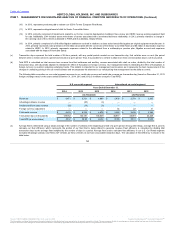
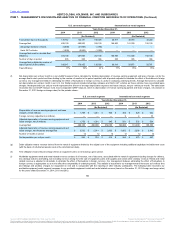
Total revenues for our U.S. Car Rental segment increased $140 million, or 2%, from the prior year. Transaction days increased 5% while Total
RPD was down 2%. The increase in transaction days was primarily related to 15% growth in the off airport market. Total RPD was negatively
impacted by the higher mix of off airport rentals driven by an increase in the number of replacement renters during the period. Off airport revenues
comprised 25% of the total segment in 2014 compared to 24% in 2013. Off airport transaction days comprised 33% of the total segment in 2014
compared with 31% in 2013.
Direct operating expenses for our U.S. Car Rental segment increased $390 million, or 11%, from the prior year due to the following:
• Fleet related expenses increased $182 million, or 25%, from 2013 primarily comprised of:
• Increased vehicle maintenance expenses of $73 million which reflects an 89% increase in maintenance expense per vehicle due
to the age and mileage of our fleet and the level of recall activity in the second, third and fourth quarters of 2014;
• Increased vehicle damage expenses of $59 million which reflects a 35% increase in expense per transaction day due to age and
mileage of the fleet, as well as growth in our off airport business;
• Increased damage related liability and third party property damage of $35 million resulting from the shift in transaction day mix to
more off airport rentals and older fleet compared with the prior year; and
• Increased other vehicle operating costs of $24 million resulting from additional vehicle registration, taxes and stolen vehicles
expenses due to our business mix.
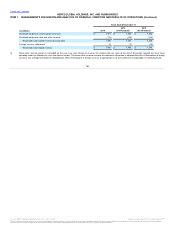
• Personnel related expenses increased $30 million, or 3%, from 2013, primarily driven by increases in field payroll wages and benefits. The
increases were driven by the off airport transaction growth in the insurance replacement business and the increased transportation
of vehicles in an effort to maximize fleet sharing initiatives between our brands as well as maintenance on a higher mileage fleet
and increased recalls.
• Other direct operating expenses increased $177 million, or 11%, from 2013 primarily comprised of:
• Increased facilities expense of $34 million primarily resulting from additional depreciation expense when compared with the prior
year due to an increase in the amount of capital expenditures on new and existing facilities;
• Increased restructuring costs of $46 million driven by our business transformation and integration initiatives;
• Increased field administration expenses of $33 million reflective of higher shared services operating expenses driven by our off
airport market expansion and employee relocation expenses related to the new headquarters in Florida;
• Increased customer service expenses of $29 million which was attributable to a change in contract terms with a certain service
provider during the year;
• Increased commissions of $33 million resulting from commission program rate changes and a shift of revenue mix to higher cost
commission reservation sources; and
47
Source: HERTZ GLOBAL HOLDINGS INC, 10-K, July 16, 2015 Powered by Morningstar® Document Research℠
The information contained herein may not be copied, adapted or distributed and is not warranted to be accurate, complete or timely. The user assumes all risks for any damages or losses arising from any use of this information,
except to the extent such damages or losses cannot be limited or excluded by applicable law. Past financial performance is no guarantee of future results.