Hertz 2014 Annual Report Download - page 62
Download and view the complete annual report
Please find page 62 of the 2014 Hertz annual report below. You can navigate through the pages in the report by either clicking on the pages listed below, or by using the keyword search tool below to find specific information within the annual report.-
 1
1 -
2
-
3
-
4
-
5
-
6
-
7
-
8
-
9
-
10
-
11
-
12
-
13
-
14
-
15
-
16
-
17
-
18
-
19
-
20
-
21
-
22
-
23
-
24
-
25
-
26
-
27
-
28
-
29
-
30
-
31
-
32
-
33
-
34
-
35
-
36
-
37
-
38
-
39
-
40
-
41
-
42
-
43
-
44
-
45
-
46
-
47
-
48
-
49
-
50
-
51
-
 52
52 -
 53
53 -
 54
54 -
 55
55 -
 56
56 -
 57
57 -
 58
58 -
 59
59 -
 60
60 -
 61
61 -
 62
62 -
 63
63 -
 64
64 -
 65
65 -
 66
66 -
 67
67 -
 68
68 -
 69
69 -
 70
70 -
 71
71 -
 72
72 -
73
-
74
-
75
-
76
-
77
-
78
-
79
-
80
-
81
-
82
-
83
-
84
-
85
-
86
-
87
-
88
-
89
-
90
-
91
-
92
-
93
-
94
-
95
-
96
-
97
-
98
-
99
-
100
-
101
-
102
-
103
-
104
-
105
-
106
-
107
-
108
-
109
-
110
-
111
-
112
-
113
-
114
-
115
-
116
-
117
-
118
-
119
-
120
-
121
-
122
-
123
-
124
-
125
-
126
-
127
-
128
-
129
-
130
-
131
-
132
-
133
-
134
-
135
-
136
-
137
-
138
-
139
-
140
-
141
-
142
-
143
-
144
-
145
-
146
-
147
-
148
-
149
-
150
-
151
-
152
-
153
-
154
-
155
-
156
-
157
-
158
-
159
-
160
-
161
-
162
-
163
-
164
-
165
-
166
-
167
-
168
-
169
-
170
-
171
-
172
-
173
-
174
-
175
-
176
-
177
-
178
-
179
-
180
-
181
-
182
-
183
-
184
-
185
-
186
-
187
-
188
-
189
-
190
-
191
-
192
-
193
-
194
-
195
-
196
-
197
-
198
-
199
-
200
-
201
-
202
-
203
-
204
-
205
-
206
-
207
-
208
-
209
-
210
-
211
-
212
-
213
-
214
-
215
-
216
-
217
-
218
-
219
-
220
-
221
-
222
-
223
-
224
-
225
-
226
-
227
-
228
-
229
-
230
-
231
-
232
-
233
-
234
-
235
-
236
-
237
-
238
-
239
-
240
-
241
-
242
-
243
-
244
-
245
-
246
-
247
-
248
-
249
-
250
-
251
-
252
-
253
-
254
-
255
-
256
-
257
-
258
-
259
-
260
-
261
-
262
-
263
-
264
-
265
-
266
-
267
-
268
-
269
-
270
-
271
-
272
-
273
-
274
-
275
-
276
-
277
-
278
-
279
-
280
-
281
-
282
-
283
-
284
-
285
-
286
-
287
-
288
-
289
-
290
-
291
-
292
-
293
-
294
-
295
-
296
-
297
-
298
-
299
-
300
-
301
-
302
-
303
-
304
-
305
-
306
-
307
-
308
-
309
-
310
-
311
-
312
-
313
-
314
-
315
-
316
-
317
-
318
-
319
-
320
-
321
-
322
-
323
-
324
-
325
-
326
-
327
-
328
-
329
-
330
-
331
-
332
-
333
-
334
-
335
-
336
-
337
-
338
-
339
-
340
-
341
-
342
-
343
-
344
-
345
-
346
-
347
-
348
-
349
-
350
-
351
-
352
-
353
-
354
-
355
-
356
-
357
-
358
-
359
-
360
-
361
-
362
-
363
-
364
-
365
-
366
-
367
-
368
-
369
-
370
-
371
-
372
-
373
-
374
-
375
-
376
-
377
-
378
-
379
-
380
-
381
-
382
-
383
-
384
-
385
-
386
 |
 |

Table of Contents
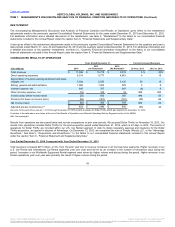
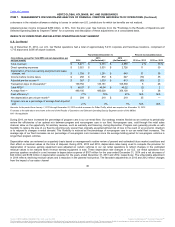
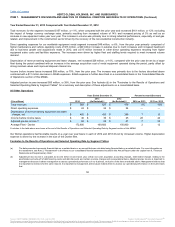
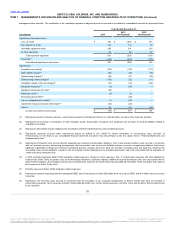
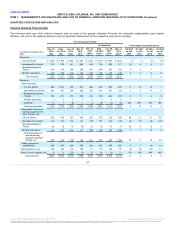
Adjusted pre-tax income increased $51 million, or 61%, from the prior year. See footnote (b) in the "Footnotes to the Results of Operations and
Selected Operating Data by Segment Tables" for a summary and description of these adjustments on a consolidated basis.
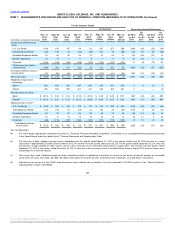
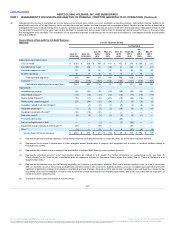
As of December 31, 2014, HERC had a total of more than 350 branches in the U.S., Canada, France, Spain, the United Kingdom, China and Saudi
Arabia.
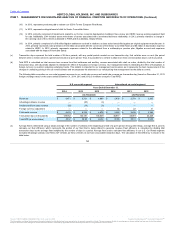
Total revenues $ 1,571
$ 1,539
$ 1,382
2 %
11%
Direct operating expenses $ 863
$ 826
$ 777
4
6
Depreciation of revenue earning equipment and lease
charges, net $ 329
$ 299
$ 271
10
10
Income before income taxes $ 170
$ 241
$ 142
(29)
70
Adjusted pre-tax income(b) $ 258
$ 301
$ 216
(14)
39
Dollar utilization(g) 36%
37%
36%
N/A
N/A
Time utilization(h) 64%
65%
62%
N/A
N/A
Rental and rental related revenue(i) $ 1,468
$ 1,400
$ 1,249
5
12
Same store revenue growth(j) 5%
10%
9%
N/A
N/A
Total revenues for the segment increased $32 million, or 2%, when compared with the prior year period and increased $54 million, or 4% excluding
the impact of foreign currency exchange rates. HERC experienced increases of 6% and 2% in worldwide equipment rental volumes and pricing,
respectively. The increase in volume was driven by growth in the non-residential construction industry, new account wins, and efforts to diversify
our customer base. Although higher than in 2013, overall segment revenues were negatively impacted by a $18 million decline in equipment sales
resulting from the closure of two dealerships and a distribution center.
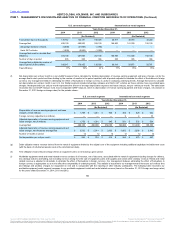
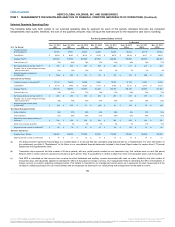
Direct operating expenses for our Worldwide Equipment Rental segment increased $37 million, or 4%, from the prior year due primarily to additional
fleet related expenses of $25 million as a result of higher maintenance costs as we refresh the equipment rental fleet.
Depreciation of revenue earning equipment and lease charges, net increased $30 million, or 10%, from the prior year. The increase was driven by a
5% increase in the average acquisition cost of rental equipment operated during the period and a $17 million decrease in gain on sale of used
equipment as HERC sold an increased amount of equipment through the auction channel in order to better align equipment available for rent with
demand.
Income before income taxes decreased $71 million, or 29%, from the prior year due mainly to the factors described above and a $30 million
increase in SG&A expenses primarily resulting from costs for the anticipated HERC spin-off transaction as well as increased costs associated
with a larger sales force. SG&A expense is further described on a consolidated basis in the Consolidated Results of Operations section of this
MD&A.
Adjusted pre-tax income decreased $43 million, or 14%, from the prior year. See footnote (b) in the "Footnotes to the Results of Operations and
Selected Operating Data by Segment Tables" for a summary and description of these adjustments on a consolidated basis.
51
Source: HERTZ GLOBAL HOLDINGS INC, 10-K, July 16, 2015 Powered by Morningstar® Document Research℠
The information contained herein may not be copied, adapted or distributed and is not warranted to be accurate, complete or timely. The user assumes all risks for any damages or losses arising from any use of this information,
except to the extent such damages or losses cannot be limited or excluded by applicable law. Past financial performance is no guarantee of future results.