Hertz 2014 Annual Report Download - page 241
Download and view the complete annual report
Please find page 241 of the 2014 Hertz annual report below. You can navigate through the pages in the report by either clicking on the pages listed below, or by using the keyword search tool below to find specific information within the annual report.-
 1
1 -
2
-
3
-
4
-
5
-
6
-
7
-
8
-
9
-
10
-
11
-
12
-
13
-
14
-
15
-
16
-
17
-
18
-
19
-
20
-
21
-
22
-
23
-
24
-
25
-
26
-
27
-
28
-
29
-
30
-
31
-
32
-
33
-
34
-
35
-
36
-
37
-
38
-
39
-
40
-
41
-
42
-
43
-
44
-
45
-
46
-
47
-
48
-
49
-
50
-
51
-
52
-
53
-
54
-
55
-
56
-
57
-
58
-
59
-
60
-
61
-
62
-
63
-
64
-
65
-
66
-
67
-
68
-
69
-
70
-
71
-
72
-
73
-
74
-
75
-
76
-
77
-
78
-
79
-
80
-
81
-
82
-
83
-
84
-
85
-
86
-
87
-
88
-
89
-
90
-
91
-
92
-
93
-
94
-
95
-
96
-
97
-
98
-
99
-
100
-
101
-
102
-
103
-
104
-
105
-
106
-
107
-
108
-
109
-
110
-
111
-
112
-
113
-
114
-
115
-
116
-
117
-
118
-
119
-
120
-
121
-
122
-
123
-
124
-
125
-
126
-
127
-
128
-
129
-
130
-
131
-
132
-
133
-
134
-
135
-
136
-
137
-
138
-
139
-
140
-
141
-
142
-
143
-
144
-
145
-
146
-
147
-
148
-
149
-
150
-
151
-
152
-
153
-
154
-
155
-
156
-
157
-
158
-
159
-
160
-
161
-
162
-
163
-
164
-
165
-
166
-
167
-
168
-
169
-
170
-
171
-
172
-
173
-
174
-
175
-
176
-
177
-
178
-
179
-
180
-
181
-
182
-
183
-
184
-
185
-
186
-
187
-
188
-
189
-
190
-
191
-
192
-
193
-
194
-
195
-
196
-
197
-
198
-
199
-
200
-
201
-
202
-
203
-
204
-
205
-
206
-
207
-
208
-
209
-
210
-
211
-
212
-
213
-
214
-
215
-
216
-
217
-
218
-
219
-
220
-
221
-
222
-
223
-
224
-
225
-
226
-
227
-
228
-
229
-
230
-
 231
231 -
 232
232 -
 233
233 -
 234
234 -
 235
235 -
 236
236 -
 237
237 -
 238
238 -
 239
239 -
 240
240 -
 241
241 -
 242
242 -
 243
243 -
 244
244 -
 245
245 -
 246
246 -
 247
247 -
 248
248 -
 249
249 -
 250
250 -
 251
251 -
252
-
253
-
254
-
255
-
256
-
257
-
258
-
259
-
260
-
261
-
262
-
263
-
264
-
265
-
266
-
267
-
268
-
269
-
270
-
271
-
272
-
273
-
274
-
275
-
276
-
277
-
278
-
279
-
280
-
281
-
282
-
283
-
284
-
285
-
286
-
287
-
288
-
289
-
290
-
291
-
292
-
293
-
294
-
295
-
296
-
297
-
298
-
299
-
300
-
301
-
302
-
303
-
304
-
305
-
306
-
307
-
308
-
309
-
310
-
311
-
312
-
313
-
314
-
315
-
316
-
317
-
318
-
319
-
320
-
321
-
322
-
323
-
324
-
325
-
326
-
327
-
328
-
329
-
330
-
331
-
332
-
333
-
334
-
335
-
336
-
337
-
338
-
339
-
340
-
341
-
342
-
343
-
344
-
345
-
346
-
347
-
348
-
349
-
350
-
351
-
352
-
353
-
354
-
355
-
356
-
357
-
358
-
359
-
360
-
361
-
362
-
363
-
364
-
365
-
366
-
367
-
368
-
369
-
370
-
371
-
372
-
373
-
374
-
375
-
376
-
377
-
378
-
379
-
380
-
381
-
382
-
383
-
384
-
385
-
386
 |
 |

Table of Contents
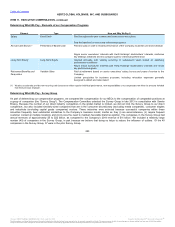
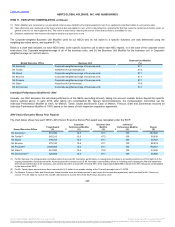
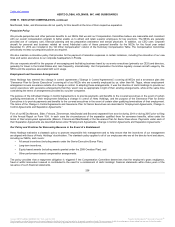
(1) Dollar utilization was measured as our annualized rental revenue divided by the original equipment cost of our equipment rental fleet relative to our business plan.
(2) Fleet efficiencies was measured as the improvement in fleet unavailable for rent, which is determined by comparing the fleet that cannot be rented due to factors under our
general control to our total equipment fleet. This metric is improved by reducing the amount of time that our fleet is unavailable for rent.
(3) Employee satisfaction was measured through an employee pulse survey score.
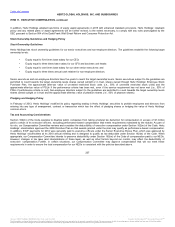
The Corporate‑weighted Business Unit Modifier used for our NEOs who do not report to a specific business unit was determined using the
weighting described above, and equaled 81.1%.
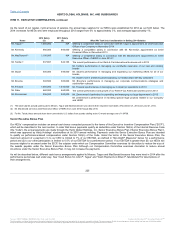
Below is a chart that indicates, for each NEO listed, (i) the specific business unit to which each NEO reports, or in the case of the corporate center
executives, the Corporate weighted-average of all of the business units, and (ii) the Business Unit Modifier for the business unit or Corporate-
weighted average as set forth above.
Mr. Kennedy
Corporate‑weighted average of business units
81.1
Mr. Taride
Hertz Rent‑A‑Car International
87.3
Mr. Stuart
Corporate‑weighted average of business units
81.1
Mr. Broome
Corporate‑weighted average of business units
81.1
Mr. Frissora
Corporate‑weighted average of business units
81.1
Mr. Sider
Hertz Rent‑A‑Car Americas
75.0
Mr. Zimmerman
Corporate‑weighted average of business units
81.1
Annually, our CEO assesses the individual performance of the NEOs (excluding himself), taking into account multiple factors beyond the specific
metrics outlined above. In early 2015, after taking into consideration Mr. Tague’s recommendations, the Compensation Committee set the
Individual Performance Modifier at 100% for Messrs. Taride, Stuart and Broome. Each of Messrs. Frissora, Sider and Zimmerman received an
Individual Performance Modifier of 100% based on the terms of their respective separation agreement.
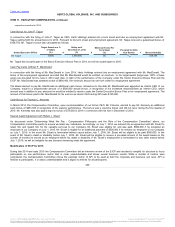
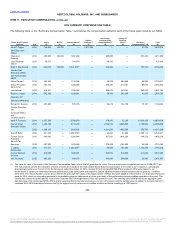
The chart below shows how each NEO’s 2014 Senior Executive Bonus Plan award was calculated under the EICP:
X
X
X
=
Mr. Kennedy(1)
561,000
12.6
81.1
100
280,500
Mr. Taride(2)
542,213
12.6
87.3
100
59,638
Mr. Stuart
378,750
12.6
81.1
100
38,703
Mr. Broome
276,150
12.6
81.1
100
28,219
Mr. Frissora(3)
2,465,000
12.6
81.1
100
178,047
Mr. Sider(3)
561,000
12.6
75.0
100
33,406
Mr. Zimmerman(3)
428,800
12.6
81.1
100
40,696
(1) For Mr. Kennedy, the Compensation Committee took into account Mr. Kennedy’s performance in managing the Company’s accounting functions in 2014 in light of (i) the
ongoing restatement of periods before Mr. Kennedy joined the Company and (ii) Mr. Kennedy’s extraordinary efforts in reviewing and evaluating the financial statements
and internal audit function of the Company, and used its discretion to award Mr. Kennedy 50% of his target award ($280,500) instead of the $57,326 payout contemplated
by the terms of the EICP.
(2) For Mr. Taride, these amounts have been converted to U.S. dollars from pounds sterling at the 12‑month average rate of 1.64739.
(3) For Messrs. Frissora, Sider and Zimmerman, these amounts were pro-rated pursuant to each executive’s separation agreement, which provided for Mr. Frissora to
receive 71%, Mr. Sider to receive 63% and Mr. Zimmerman to receive 93% of the EICP bonus earned by each
229
Source: HERTZ GLOBAL HOLDINGS INC, 10-K, July 16, 2015 Powered by Morningstar® Document Research℠
The information contained herein may not be copied, adapted or distributed and is not warranted to be accurate, complete or timely. The user assumes all risks for any damages or losses arising from any use of this information,
except to the extent such damages or losses cannot be limited or excluded by applicable law. Past financial performance is no guarantee of future results.