Hertz 2014 Annual Report Download - page 173
Download and view the complete annual report
Please find page 173 of the 2014 Hertz annual report below. You can navigate through the pages in the report by either clicking on the pages listed below, or by using the keyword search tool below to find specific information within the annual report.-
 1
1 -
2
-
3
-
4
-
5
-
6
-
7
-
8
-
9
-
10
-
11
-
12
-
13
-
14
-
15
-
16
-
17
-
18
-
19
-
20
-
21
-
22
-
23
-
24
-
25
-
26
-
27
-
28
-
29
-
30
-
31
-
32
-
33
-
34
-
35
-
36
-
37
-
38
-
39
-
40
-
41
-
42
-
43
-
44
-
45
-
46
-
47
-
48
-
49
-
50
-
51
-
52
-
53
-
54
-
55
-
56
-
57
-
58
-
59
-
60
-
61
-
62
-
63
-
64
-
65
-
66
-
67
-
68
-
69
-
70
-
71
-
72
-
73
-
74
-
75
-
76
-
77
-
78
-
79
-
80
-
81
-
82
-
83
-
84
-
85
-
86
-
87
-
88
-
89
-
90
-
91
-
92
-
93
-
94
-
95
-
96
-
97
-
98
-
99
-
100
-
101
-
102
-
103
-
104
-
105
-
106
-
107
-
108
-
109
-
110
-
111
-
112
-
113
-
114
-
115
-
116
-
117
-
118
-
119
-
120
-
121
-
122
-
123
-
124
-
125
-
126
-
127
-
128
-
129
-
130
-
131
-
132
-
133
-
134
-
135
-
136
-
137
-
138
-
139
-
140
-
141
-
142
-
143
-
144
-
145
-
146
-
147
-
148
-
149
-
150
-
151
-
152
-
153
-
154
-
155
-
156
-
157
-
158
-
159
-
160
-
161
-
162
-
 163
163 -
 164
164 -
 165
165 -
 166
166 -
 167
167 -
 168
168 -
 169
169 -
 170
170 -
 171
171 -
 172
172 -
 173
173 -
 174
174 -
 175
175 -
 176
176 -
 177
177 -
 178
178 -
 179
179 -
 180
180 -
 181
181 -
 182
182 -
 183
183 -
184
-
185
-
186
-
187
-
188
-
189
-
190
-
191
-
192
-
193
-
194
-
195
-
196
-
197
-
198
-
199
-
200
-
201
-
202
-
203
-
204
-
205
-
206
-
207
-
208
-
209
-
210
-
211
-
212
-
213
-
214
-
215
-
216
-
217
-
218
-
219
-
220
-
221
-
222
-
223
-
224
-
225
-
226
-
227
-
228
-
229
-
230
-
231
-
232
-
233
-
234
-
235
-
236
-
237
-
238
-
239
-
240
-
241
-
242
-
243
-
244
-
245
-
246
-
247
-
248
-
249
-
250
-
251
-
252
-
253
-
254
-
255
-
256
-
257
-
258
-
259
-
260
-
261
-
262
-
263
-
264
-
265
-
266
-
267
-
268
-
269
-
270
-
271
-
272
-
273
-
274
-
275
-
276
-
277
-
278
-
279
-
280
-
281
-
282
-
283
-
284
-
285
-
286
-
287
-
288
-
289
-
290
-
291
-
292
-
293
-
294
-
295
-
296
-
297
-
298
-
299
-
300
-
301
-
302
-
303
-
304
-
305
-
306
-
307
-
308
-
309
-
310
-
311
-
312
-
313
-
314
-
315
-
316
-
317
-
318
-
319
-
320
-
321
-
322
-
323
-
324
-
325
-
326
-
327
-
328
-
329
-
330
-
331
-
332
-
333
-
334
-
335
-
336
-
337
-
338
-
339
-
340
-
341
-
342
-
343
-
344
-
345
-
346
-
347
-
348
-
349
-
350
-
351
-
352
-
353
-
354
-
355
-
356
-
357
-
358
-
359
-
360
-
361
-
362
-
363
-
364
-
365
-
366
-
367
-
368
-
369
-
370
-
371
-
372
-
373
-
374
-
375
-
376
-
377
-
378
-
379
-
380
-
381
-
382
-
383
-
384
-
385
-
386
 |
 |

Table of Contents
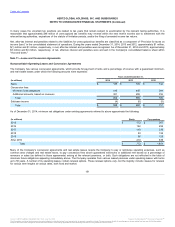
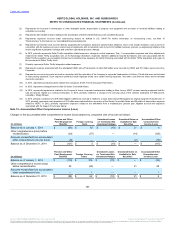
The following table sets forth the activity affecting the restructuring accrual during the years ended December 31, 2014 and 2013. The Company
expects to pay the remaining restructuring obligations relating to termination benefits over the next twelve months. The remainder of the
restructuring accrual relates to future lease obligations which will be paid over the remaining term of the applicable leases.
Balance as of January 1, 2013 $ 12
$ 8
$ 20
Charges incurred 42
35
77
Cash payments (33)
(15)
(48)
Other (1)
—
(1)
Balance as of December 31, 2013 $ 20
$ 28
$ 48
Charges incurred 30
48
78
Cash payments (28)
(25)
(53)
Other(a) (1)
(29)
(30)
Balance as of December 31, 2014 $ 21
$ 22
$ 43
(a) Decrease primarily consists of $10 million related to the write-down of assets assets associated with a terminated business relationship and $13 million related to the
impairment of the Company's former corporate headquarters building in New Jersey which were recorded in direct operating and selling, general and administrative
expenses, respectively.
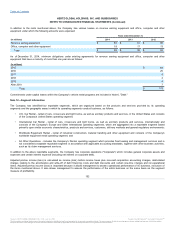
The Company employs established risk management policies and procedures, which seek to reduce the Company’s commercial risk exposure to
fluctuations in commodity prices, interest rates and currency exchange rates. However, there can be no assurance that these policies and
procedures will be successful. Although the instruments utilized involve varying degrees of credit, market and interest risk, the counterparties to
the agreements are expected to perform fully under the terms of the agreements. The Company monitors counterparty credit risk, including
lenders, on a regular basis, but cannot be certain that all risks will be discerned or that its risk management policies and procedures will always be
effective. Additionally, in the event of default under the Company’s master derivative agreements, the nondefaulting party has the option to set-off
any amounts owed with regard to open derivative positions.
The Company has the following risk exposures that it has historically used financial instruments to manage. None of the instruments have been
designated in a hedging relationship as of December 31, 2014 and 2013.
The Company’s objective in managing exposure to interest rate changes is to minimize the impact of interest rate changes on earnings and cash
flows and to lower overall borrowing costs. To achieve these objectives, the Company may use interest rate caps and other instruments to
manage the mix of floating and fixed-rate debt.
The Company’s objective in managing exposure to currency fluctuations is to limit the exposure of certain cash flows and earnings from changes
associated with currency exchange rate changes through the use of various derivative contracts. The Company experiences currency risks in its
global operations as a result of various factors including intercompany local currency denominated loans, rental operations in various currencies
and purchasing fleet in various currencies.
161
Source: HERTZ GLOBAL HOLDINGS INC, 10-K, July 16, 2015 Powered by Morningstar® Document Research℠
The information contained herein may not be copied, adapted or distributed and is not warranted to be accurate, complete or timely. The user assumes all risks for any damages or losses arising from any use of this information,
except to the extent such damages or losses cannot be limited or excluded by applicable law. Past financial performance is no guarantee of future results.