Hertz 2014 Annual Report Download - page 70
Download and view the complete annual report
Please find page 70 of the 2014 Hertz annual report below. You can navigate through the pages in the report by either clicking on the pages listed below, or by using the keyword search tool below to find specific information within the annual report.-
 1
1 -
2
-
3
-
4
-
5
-
6
-
7
-
8
-
9
-
10
-
11
-
12
-
13
-
14
-
15
-
16
-
17
-
18
-
19
-
20
-
21
-
22
-
23
-
24
-
25
-
26
-
27
-
28
-
29
-
30
-
31
-
32
-
33
-
34
-
35
-
36
-
37
-
38
-
39
-
40
-
41
-
42
-
43
-
44
-
45
-
46
-
47
-
48
-
49
-
50
-
51
-
52
-
53
-
54
-
55
-
56
-
57
-
58
-
59
-
 60
60 -
 61
61 -
 62
62 -
 63
63 -
 64
64 -
 65
65 -
 66
66 -
 67
67 -
 68
68 -
 69
69 -
 70
70 -
 71
71 -
 72
72 -
 73
73 -
 74
74 -
 75
75 -
 76
76 -
 77
77 -
 78
78 -
 79
79 -
 80
80 -
81
-
82
-
83
-
84
-
85
-
86
-
87
-
88
-
89
-
90
-
91
-
92
-
93
-
94
-
95
-
96
-
97
-
98
-
99
-
100
-
101
-
102
-
103
-
104
-
105
-
106
-
107
-
108
-
109
-
110
-
111
-
112
-
113
-
114
-
115
-
116
-
117
-
118
-
119
-
120
-
121
-
122
-
123
-
124
-
125
-
126
-
127
-
128
-
129
-
130
-
131
-
132
-
133
-
134
-
135
-
136
-
137
-
138
-
139
-
140
-
141
-
142
-
143
-
144
-
145
-
146
-
147
-
148
-
149
-
150
-
151
-
152
-
153
-
154
-
155
-
156
-
157
-
158
-
159
-
160
-
161
-
162
-
163
-
164
-
165
-
166
-
167
-
168
-
169
-
170
-
171
-
172
-
173
-
174
-
175
-
176
-
177
-
178
-
179
-
180
-
181
-
182
-
183
-
184
-
185
-
186
-
187
-
188
-
189
-
190
-
191
-
192
-
193
-
194
-
195
-
196
-
197
-
198
-
199
-
200
-
201
-
202
-
203
-
204
-
205
-
206
-
207
-
208
-
209
-
210
-
211
-
212
-
213
-
214
-
215
-
216
-
217
-
218
-
219
-
220
-
221
-
222
-
223
-
224
-
225
-
226
-
227
-
228
-
229
-
230
-
231
-
232
-
233
-
234
-
235
-
236
-
237
-
238
-
239
-
240
-
241
-
242
-
243
-
244
-
245
-
246
-
247
-
248
-
249
-
250
-
251
-
252
-
253
-
254
-
255
-
256
-
257
-
258
-
259
-
260
-
261
-
262
-
263
-
264
-
265
-
266
-
267
-
268
-
269
-
270
-
271
-
272
-
273
-
274
-
275
-
276
-
277
-
278
-
279
-
280
-
281
-
282
-
283
-
284
-
285
-
286
-
287
-
288
-
289
-
290
-
291
-
292
-
293
-
294
-
295
-
296
-
297
-
298
-
299
-
300
-
301
-
302
-
303
-
304
-
305
-
306
-
307
-
308
-
309
-
310
-
311
-
312
-
313
-
314
-
315
-
316
-
317
-
318
-
319
-
320
-
321
-
322
-
323
-
324
-
325
-
326
-
327
-
328
-
329
-
330
-
331
-
332
-
333
-
334
-
335
-
336
-
337
-
338
-
339
-
340
-
341
-
342
-
343
-
344
-
345
-
346
-
347
-
348
-
349
-
350
-
351
-
352
-
353
-
354
-
355
-
356
-
357
-
358
-
359
-
360
-
361
-
362
-
363
-
364
-
365
-
366
-
367
-
368
-
369
-
370
-
371
-
372
-
373
-
374
-
375
-
376
-
377
-
378
-
379
-
380
-
381
-
382
-
383
-
384
-
385
-
386
 |
 |
Table of Contents
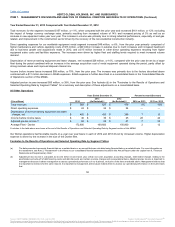
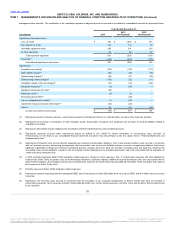
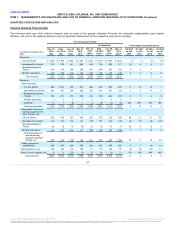
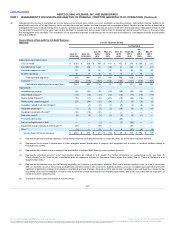
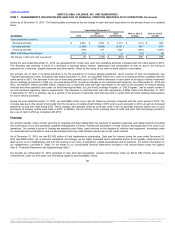
The following table sets forth certain of our selected operating data by segment for each of the periods indicated. Amounts are computed
independently each quarter, therefore, the sum of the quarterly amounts may not equal the total amount for the respective year due to rounding.
Transaction days
(in thousands) (b) 33,595
37,901
35,850
32,360
32,875
36,064
34,178
30,064
Total RPD(c) $ 43.85
$ 46.41
$ 46.19
$ 47.90
$ 44.75
$ 48.36
$ 46.11
$ 48.63
Average Fleet (g) 486,900
515,300
502,500
491,500
490,200
516,800
499,000
454,000
Fleet efficiency (g) 75%
80%
79%
75%
76%
80%
79%
77%
Net depreciation per unit per month (h) $ 365
$ 265
$ 259
$ 288
$ 229
$ 217
$ 216
$ 209
Program cars as a percentage of average
fleet at period end 21%
15%
16%
15%
9%
7%
3%
4%
Adjusted pre-tax income(loss)
(in millions)(d) $ (126)
$ 209
$ 184
$ 119
$ 132
$ 379
$ 289
$ 232
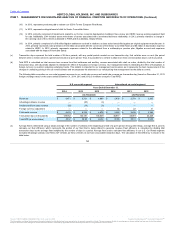
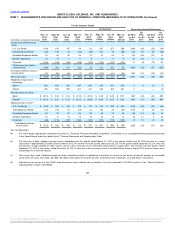
Transaction days (in thousands)(b) 10,734
14,695
12,096
9,395
10,473
14,278
11,261
9,006
Total RPD(c) $ 51.70
$ 54.85
$ 52.58
$ 51.41
$ 51.85
$ 55.12
$ 53.73
$ 51.63
Average Fleet (g) 156,700
196,900
172,300
141,400
155,700
188,700
163,500
137,500
Fleet efficiency (g) 74%
81%
77%
74%
73%
82%
76%
73%
Net depreciation per unit per month (h) $ 255
$ 245
$ 238
$ 266
$ 255
$ 274
$ 273
$ 301
Program cars as a percentage of average
fleet at period end 30%
40%
42%
34%
24%
36%
38%
28%
Adjusted pre-tax income (loss)
(in millions)(d) $ (12)
$ 136
$ 57
$ (39)
$ 21
$ 126
$ 35
$ (47)
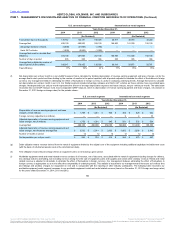
Dollar utilization 38%
37%
35%
34%
38%
38%
37%
35%
Time utilization 67%
66%
63%
61%
66%
67%
64%
61%
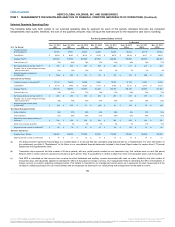
Rental and rental related revenue (in
millions)(e) $ 394
$ 382
$ 356
$ 334
$ 366
$ 369
$ 343
$ 320
Same store revenue growth(f) 5%
6%
4%
5%
5%
7%
11%
13%
Adjusted pre-tax income (in millions)(d) $ 60
$ 79
$ 67
$ 52
$ 93
$ 89
$ 73
$ 45
Average Fleet - Donlen 166,800
169,700
177,800
176,800
173,800
170,800
168,000
165,600
Adjusted pre-tax income (in millions)(d) $ 15
$ 17
$ 15
$ 16
$ 16
$ 14
$ 14
$ 13
(a) The data presented represents financial data on a restated basis or an amount that was calculated using financial data on a restated basis. For more information on
the restatement, see Note 2, "Restatement" to the Notes to our consolidated financial statements included in this Annual Report under the caption Item 8, "Financial
Statements and Supplementary Data.
(b) Transaction days represent the total number of 24-hour periods, with any partial period counted as one transaction day, that vehicles were on rent (the period
between when a rental contract is opened and closed) in a given period. Thus, it is possible for a vehicle to attain more than one transaction day in a 24-hour period.
(c) Total RPD is calculated as total revenue less revenue from fleet subleases and ancillary revenue associated with retail car sales, divided by the total number of
transaction days, with all periods adjusted to eliminate the effect of fluctuations in foreign currency. Our management believes eliminating the effect of fluctuations in
foreign currency is useful in analyzing underlying trends. This statistic is important to our management and investors as it represents the best measurement of the
changes in underlying pricing in the car rental business and encompasses the elements in car rental pricing that management has the ability to control.
59
Source: HERTZ GLOBAL HOLDINGS INC, 10-K, July 16, 2015 Powered by Morningstar® Document Research℠
The information contained herein may not be copied, adapted or distributed and is not warranted to be accurate, complete or timely. The user assumes all risks for any damages or losses arising from any use of this information,
except to the extent such damages or losses cannot be limited or excluded by applicable law. Past financial performance is no guarantee of future results.